## Line Graph: KG-Trie Performance Metrics vs. Path Length
### Overview
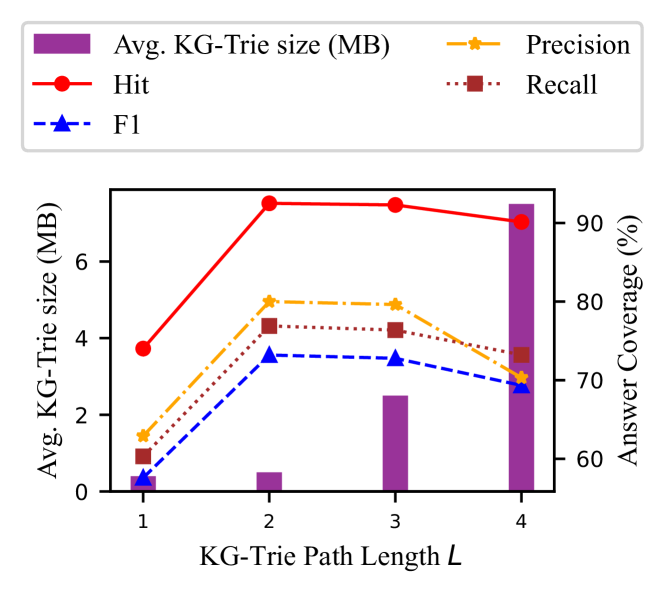
The image is a line graph comparing four performance metrics of a KG-Trie data structure across different path lengths (L=1 to L=4). The y-axis represents average KG-Trie size in MB, while the x-axis represents path length. Four data series are plotted: average KG-Trie size (purple), precision (orange), recall (brown), and F1 score (blue). A red line labeled "Hit" is also present but not explicitly defined in the legend.
### Components/Axes
- **X-axis (Horizontal)**: "KG-Trie Path Length L" with discrete categories 1, 2, 3, 4.
- **Y-axis (Vertical)**: "Avg. KG-Trie size (MB)" with a logarithmic scale (0 to 9).
- **Legend**: Located in the top-left corner, with color-coded labels:
- Purple: Avg. KG-Trie size (MB)
- Orange: Precision
- Brown: Recall
- Blue: F1
- Red: Hit (not explicitly defined in legend but visually distinct)
### Detailed Analysis
1. **Avg. KG-Trie size (MB)** (Purple):
- L=1: ~0.5 MB
- L=2: ~4 MB
- L=3: ~6.5 MB
- L=4: ~7 MB
- *Trend*: Steadily increases with path length.
2. **Precision** (Orange):
- L=1: ~1.5%
- L=2: ~4.5%
- L=3: ~4.2%
- L=4: ~3%
- *Trend*: Peaks at L=2, then declines.
3. **Recall** (Brown):
- L=1: ~0.5%
- L=2: ~4%
- L=3: ~3.8%
- L=4: ~3.5%
- *Trend*: Peaks at L=2, then declines.
4. **F1 Score** (Blue):
- L=1: ~0.2%
- L=2: ~3.5%
- L=3: ~3.2%
- L=4: ~3%
- *Trend*: Peaks at L=2, then declines.
5. **Hit Rate** (Red):
- L=1: ~3.5%
- L=2: ~8%
- L=3: ~8%
- L=4: ~7%
- *Trend*: Peaks at L=2, then slightly declines.
### Key Observations
- **Trie Size vs. Performance**: Larger path lengths (L=3,4) correlate with significantly larger trie sizes but reduced precision, recall, and F1 scores.
- **Optimal Path Length**: L=2 achieves the highest precision, recall, and F1 scores, suggesting a balance between efficiency and performance.
- **Hit Rate Anomaly**: The "Hit" metric peaks at L=2 but remains high at L=3, indicating potential redundancy in longer paths.
- **Scale Discrepancy**: The y-axis uses a logarithmic scale for trie size, while performance metrics use a linear scale, making direct comparisons challenging.
### Interpretation
The data suggests that shorter path lengths (L=1-2) optimize performance metrics (precision, recall, F1) while keeping trie sizes manageable. However, longer paths (L=3-4) drastically increase storage requirements with diminishing returns in performance. The "Hit" metric’s peak at L=2 implies this path length may represent an optimal trade-off between query efficiency and resource usage. The lack of a clear definition for the "Hit" metric (e.g., hit rate for specific queries) limits deeper analysis. The logarithmic scale for trie size emphasizes exponential growth, highlighting scalability concerns for large L values.