## Line Graph: Relationship Between N-labels and LC-Protons/Time
### Overview
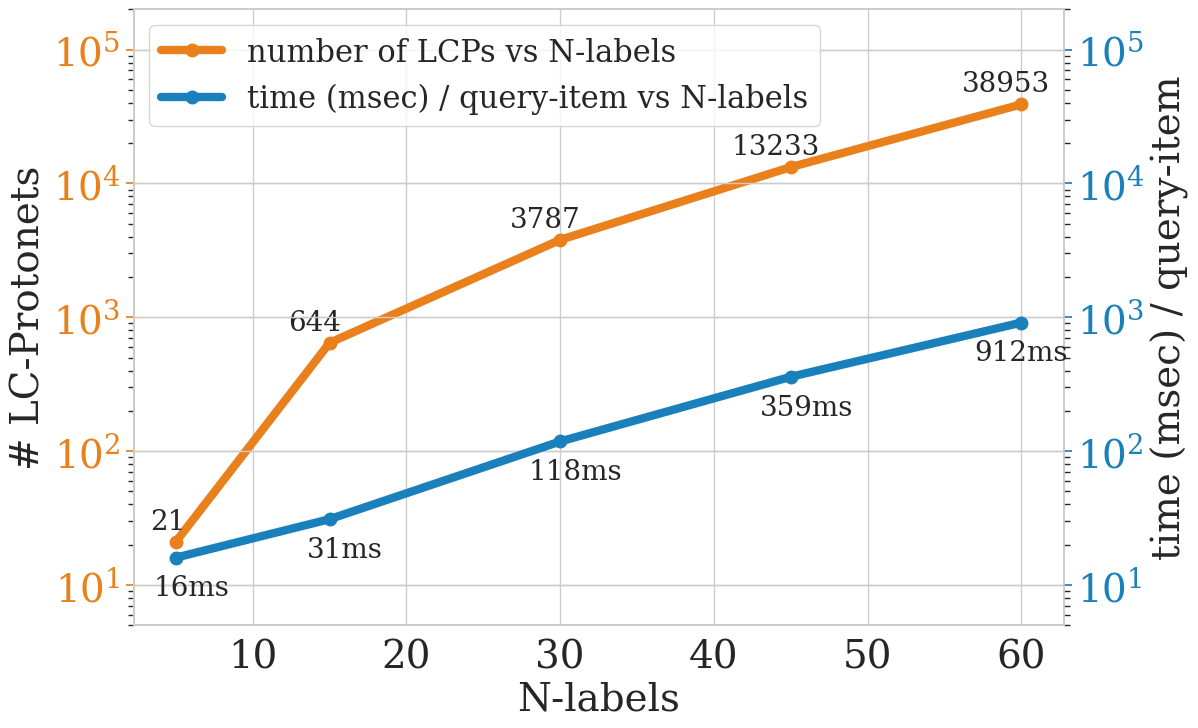
The image is a dual-axis line graph comparing two metrics: the number of LC-Protons and the time (in milliseconds) per query-item, both plotted against the number of N-labels. The graph uses logarithmic scales for both y-axes to accommodate exponential growth trends. Two data series are represented: an orange line for LC-Protons and a blue line for time.
### Components/Axes
- **X-axis (Horizontal)**: Labeled "N-labels" with values ranging from 10 to 60 in increments of 10.
- **Left Y-axis**: Labeled "# LC-Protons" with a logarithmic scale (10¹ to 10⁵).
- **Right Y-axis**: Labeled "time (msec) / query-item vs N-labels" with a logarithmic scale (10¹ to 10⁵).
- **Legend**: Located in the top-left corner, with:
- **Orange line**: "number of LCPs vs N-labels"
- **Blue line**: "time (msec) / query-item vs N-labels"
### Detailed Analysis
#### Orange Line (LC-Protons)
- **Data Points**:
- N=10: 21 LC-Protons
- N=15: 644 LC-Protons
- N=30: 3,787 LC-Protons
- N=45: 13,233 LC-Protons
- N=60: 38,953 LC-Protons
- **Trend**: Exponential growth. The line slopes steeply upward, with values increasing by orders of magnitude as N-labels rise.
#### Blue Line (Time)
- **Data Points**:
- N=10: 16ms
- N=15: 31ms
- N=30: 118ms
- N=45: 359ms
- N=60: 912ms
- **Trend**: Linear growth. The line slopes gradually upward, with time increasing proportionally to N-labels.
### Key Observations
1. **Exponential vs. Linear Growth**: The orange line (LC-Protons) grows exponentially, while the blue line (time) grows linearly.
2. **Divergence at Higher N-labels**: At N=60, LC-Protons reach 38,953 (10⁴.⁶), while time is 912ms (10².⁹⁶), highlighting a stark disparity in scaling.
3. **Consistent Scaling**: Both metrics increase monotonically with N-labels, but LC-Protons dominate in magnitude.
### Interpretation
The graph demonstrates that as the number of N-labels increases, the system's LC-Proton count grows exponentially, suggesting a potential bottleneck or inefficiency in resource allocation. Meanwhile, the time per query-item increases linearly, indicating that computational overhead scales predictably but less severely. This divergence implies that optimizing LC-Proton usage could be critical for maintaining performance at scale, as the exponential growth may lead to resource exhaustion long before time-based constraints become limiting.