# Technical Document Extraction: Probability Density Analysis
## Overview
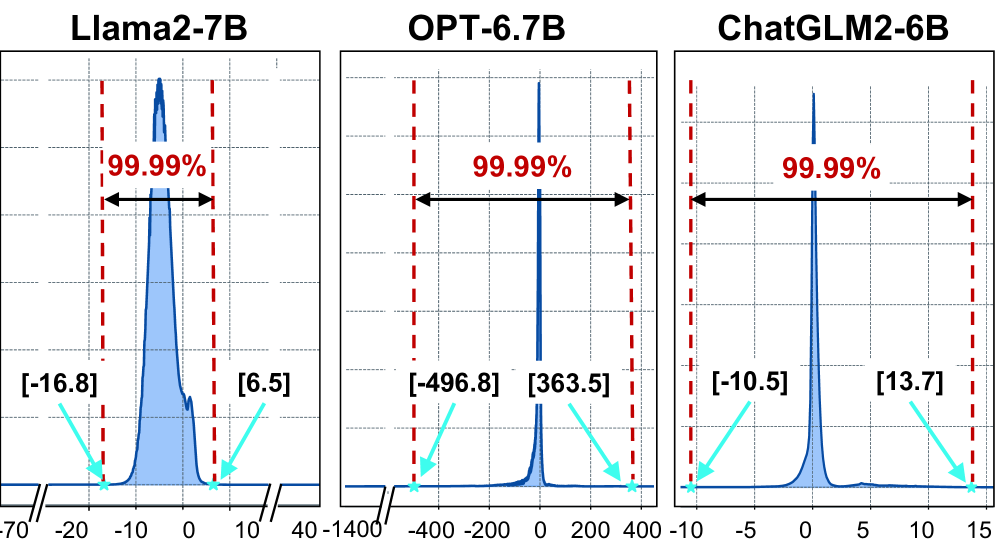
The image contains three comparative probability density charts for language models: **Llama2-7B**, **OPT-6.7B**, and **ChatGLM2-6B**. Each chart visualizes the distribution of a metric (likely log-probabilities or similar) with confidence intervals and key statistical markers.
---
## Chart 1: Llama2-7B
### Key Components
- **Title**: Llama2-7B
- **X-Axis**: Ranges from **-70** to **10** (labeled "Probability Density").
- **Y-Axis**: Labeled "Probability Density" (no explicit scale).
- **Blue Line**: Represents the probability density distribution.
- **Red Dashed Lines**: Mark the **99.99% confidence interval**.
- **Annotations**:
- **Peak**: At **x = 0**, with a value of **99.99%**.
- **Left Tail**: Arrow points to **x = -16.8** (value: `[-16.8]`).
- **Right Tail**: Arrow points to **x = 6.5** (value: `[6.5]`).
### Trends
- The distribution is sharply peaked at **x = 0**, indicating high concentration around the mean.
- The 99.99% confidence interval spans **[-16.8, 6.5]**, with the right tail extending further than the left.
---
## Chart 2: OPT-6.7B
### Key Components
- **Title**: OPT-6.7B
- **X-Axis**: Ranges from **-1400** to **400** (labeled "Probability Density").
- **Y-Axis**: Labeled "Probability Density" (no explicit scale).
- **Blue Line**: Represents the probability density distribution.
- **Red Dashed Lines**: Mark the **99.99% confidence interval**.
- **Annotations**:
- **Peak**: At **x = 0**, with a value of **99.99%**.
- **Left Tail**: Arrow points to **x = -496.8** (value: `[-496.8]`).
- **Right Tail**: Arrow points to **x = 363.5** (value: `[363.5]`).
### Trends
- The distribution is also sharply peaked at **x = 0**, but with a much wider spread.
- The 99.99% confidence interval spans **[-496.8, 363.5]**, showing significant asymmetry (left tail is longer).
---
## Chart 3: ChatGLM2-6B
### Key Components
- **Title**: ChatGLM2-6B
- **X-Axis**: Ranges from **-10** to **15** (labeled "Probability Density").
- **Y-Axis**: Labeled "Probability Density" (no explicit scale).
- **Blue Line**: Represents the probability density distribution.
- **Red Dashed Lines**: Mark the **99.99% confidence interval**.
- **Annotations**:
- **Peak**: At **x = 0**, with a value of **99.99%**.
- **Left Tail**: Arrow points to **x = -10.5** (value: `[-10.5]`).
- **Right Tail**: Arrow points to **x = 13.7** (value: `[13.7]`).
### Trends
- The distribution is sharply peaked at **x = 0**, with a narrower spread compared to OPT-6.7B.
- The 99.99% confidence interval spans **[-10.5, 13.7]**, showing near-symmetry.
---
## Cross-Chart Analysis
1. **Peak Consistency**: All models show a peak at **x = 0** with **99.99%** probability density.
2. **Confidence Intervals**:
- Llama2-7B: **[-16.8, 6.5]** (asymmetric).
- OPT-6.7B: **[-496.8, 363.5]** (highly asymmetric).
- ChatGLM2-6B: **[-10.5, 13.7]** (nearly symmetric).
3. **X-Axis Ranges**:
- Llama2-7B: Narrowest range (**-70 to 10**).
- OPT-6.7B: Widest range (**-1400 to 400**).
- ChatGLM2-6B: Moderate range (**-10 to 15**).
---
## Notes
- **No Legend**: Colors (blue for lines, red for dashed lines) are consistent across charts but lack explicit legend labels.
- **Language**: All text is in English.
- **Missing Elements**: No explicit axis scales (y-axis values are unlabeled), and no secondary metrics are provided.
---
## Conclusion
The charts compare the probability density distributions of three language models, highlighting their central tendencies (peaks at 0) and variability (confidence intervals). OPT-6.7B exhibits the widest spread, while ChatGLM2-6B shows the most symmetry.