\n
## Pie Charts: Model Performance Analysis
### Overview
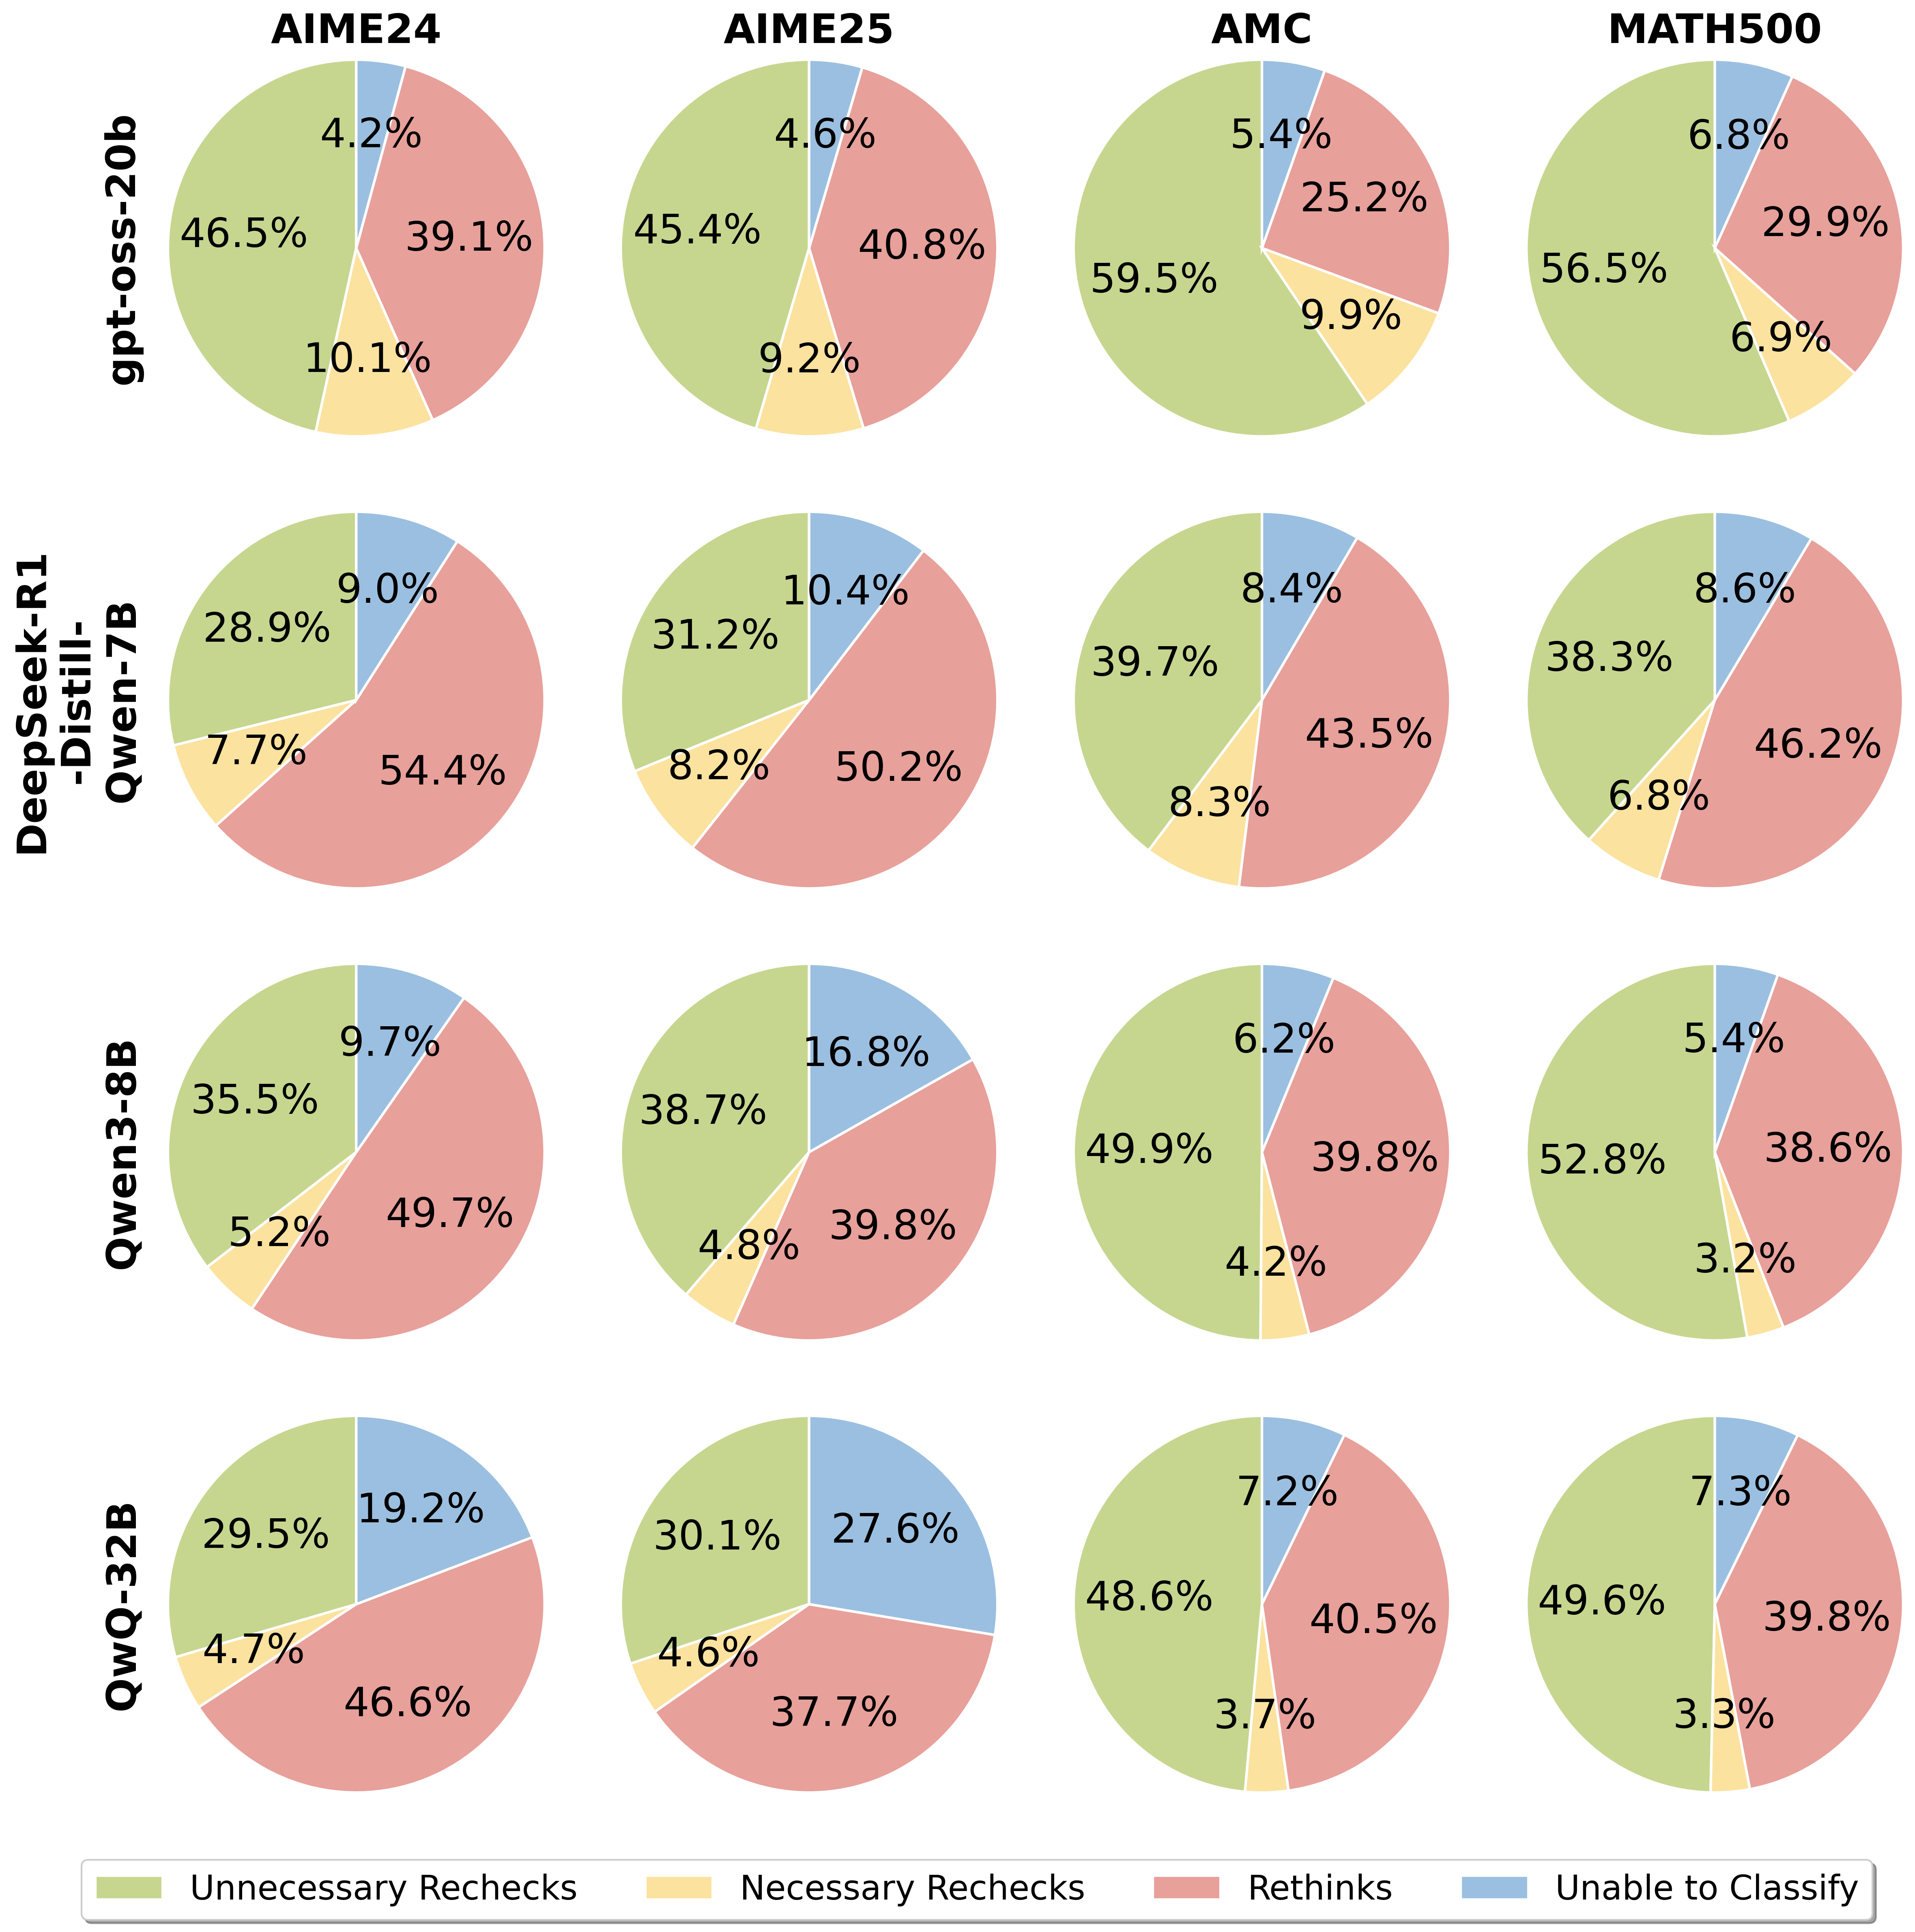
The image presents a 4x4 grid of pie charts, each representing the performance of a different Large Language Model (LLM) on a specific benchmark dataset. The charts categorize the model's behavior into four classes: "Unnecessary Rechecks", "Necessary Rechecks", "Rethinks", and "Unable to Classify". The models are listed vertically on the left side, and the datasets are listed horizontally across the top.
### Components/Axes
* **Models (Vertical Axis):**
* gpt-oss-20b
* DeepSeek-R1-Distill-Qwen-7B
* Qwen3-8B
* QwQ-3-3B
* **Datasets (Horizontal Axis):**
* AIME24
* AIME25
* AMC
* MATH500
* **Legend (Bottom):**
* Green: Unnecessary Rechecks
* Yellow: Necessary Rechecks
* Red: Rethinks
* Gray: Unable to Classify
### Detailed Analysis
**1. gpt-oss-20b**
* **AIME24:** 4.2% Unnecessary Rechecks, 39.1% Necessary Rechecks, 10.1% Rethinks, 46.5% Unable to Classify.
* **AIME25:** 4.6% Unnecessary Rechecks, 40.8% Necessary Rechecks, 9.2% Rethinks, 45.4% Unable to Classify.
* **AMC:** 5.4% Unnecessary Rechecks, 25.2% Necessary Rechecks, 9.9% Rethinks, 59.5% Unable to Classify.
* **MATH500:** 6.8% Unnecessary Rechecks, 29.9% Necessary Rechecks, 6.9% Rethinks, 56.5% Unable to Classify.
**2. DeepSeek-R1-Distill-Qwen-7B**
* **AIME24:** 7.7% Unnecessary Rechecks, 54.4% Necessary Rechecks, 28.9% Rethinks, 9.0% Unable to Classify.
* **AIME25:** 8.2% Unnecessary Rechecks, 50.2% Necessary Rechecks, 31.2% Rethinks, 10.4% Unable to Classify.
* **AMC:** 8.3% Unnecessary Rechecks, 43.5% Necessary Rechecks, 39.7% Rethinks, 8.4% Unable to Classify.
* **MATH500:** 6.8% Unnecessary Rechecks, 46.2% Necessary Rechecks, 38.3% Rethinks, 8.6% Unable to Classify.
**3. Qwen3-8B**
* **AIME24:** 5.2% Unnecessary Rechecks, 49.7% Necessary Rechecks, 35.5% Rethinks, 9.7% Unable to Classify.
* **AIME25:** 4.8% Unnecessary Rechecks, 39.8% Necessary Rechecks, 38.7% Rethinks, 16.8% Unable to Classify.
* **AMC:** 4.2% Unnecessary Rechecks, 39.8% Necessary Rechecks, 49.9% Rethinks, 6.2% Unable to Classify.
* **MATH500:** 3.2% Unnecessary Rechecks, 38.6% Necessary Rechecks, 52.8% Rethinks, 5.4% Unable to Classify.
**4. QwQ-3-3B**
* **AIME24:** 4.7% Unnecessary Rechecks, 46.6% Necessary Rechecks, 29.5% Rethinks, 19.2% Unable to Classify.
* **AIME25:** 4.6% Unnecessary Rechecks, 37.7% Necessary Rechecks, 30.1% Rethinks, 27.6% Unable to Classify.
* **AMC:** 3.7% Unnecessary Rechecks, 40.5% Necessary Rechecks, 48.6% Rethinks, 7.2% Unable to Classify.
* **MATH500:** 3.3% Unnecessary Rechecks, 39.8% Necessary Rechecks, 49.6% Rethinks, 7.3% Unable to Classify.
### Key Observations
* **Unable to Classify:** The "Unable to Classify" category consistently represents the largest proportion for gpt-oss-20b across all datasets, ranging from 45.4% to 59.5%.
* **Necessary Rechecks:** "Necessary Rechecks" are the dominant category for DeepSeek-R1-Distill-Qwen-7B and Qwen3-8B, often exceeding 40% and 50% respectively.
* **Rethinks:** The "Rethinks" category is prominent for Qwen3-8B, particularly on the MATH500 dataset (52.8%).
* **Low Unnecessary Rechecks:** All models exhibit relatively low percentages of "Unnecessary Rechecks," generally below 10%.
* **Dataset Variation:** The distribution of categories varies significantly across datasets. For example, AMC shows a higher proportion of "Unable to Classify" for gpt-oss-20b compared to AIME24.
### Interpretation
The data suggests that the performance of these LLMs varies considerably depending on the benchmark dataset. gpt-oss-20b struggles the most with all datasets, frequently being "Unable to Classify" the correct answer. This could indicate a limitation in its generalization ability or a sensitivity to the specific characteristics of each dataset. DeepSeek-R1-Distill-Qwen-7B and Qwen3-8B appear to rely more on "Necessary Rechecks," suggesting they are more likely to identify potential errors and require further verification. Qwen3-8B's high "Rethinks" rate on MATH500 might indicate a tendency to explore multiple solution paths, potentially leading to more accurate results but also increased computational cost. The relatively low "Unnecessary Rechecks" across all models suggest that they are generally efficient in avoiding redundant processing.
The differences in category distributions across datasets highlight the importance of evaluating LLMs on a diverse range of benchmarks to obtain a comprehensive understanding of their capabilities and limitations. The data also suggests that different models may be better suited for different types of tasks, depending on their strengths and weaknesses. Further investigation could explore the reasons behind the high "Unable to Classify" rate for gpt-oss-20b and the high "Rethinks" rate for Qwen3-8B on specific datasets.