## Pie Chart Grid: Model Performance Analysis Across Datasets
### Overview
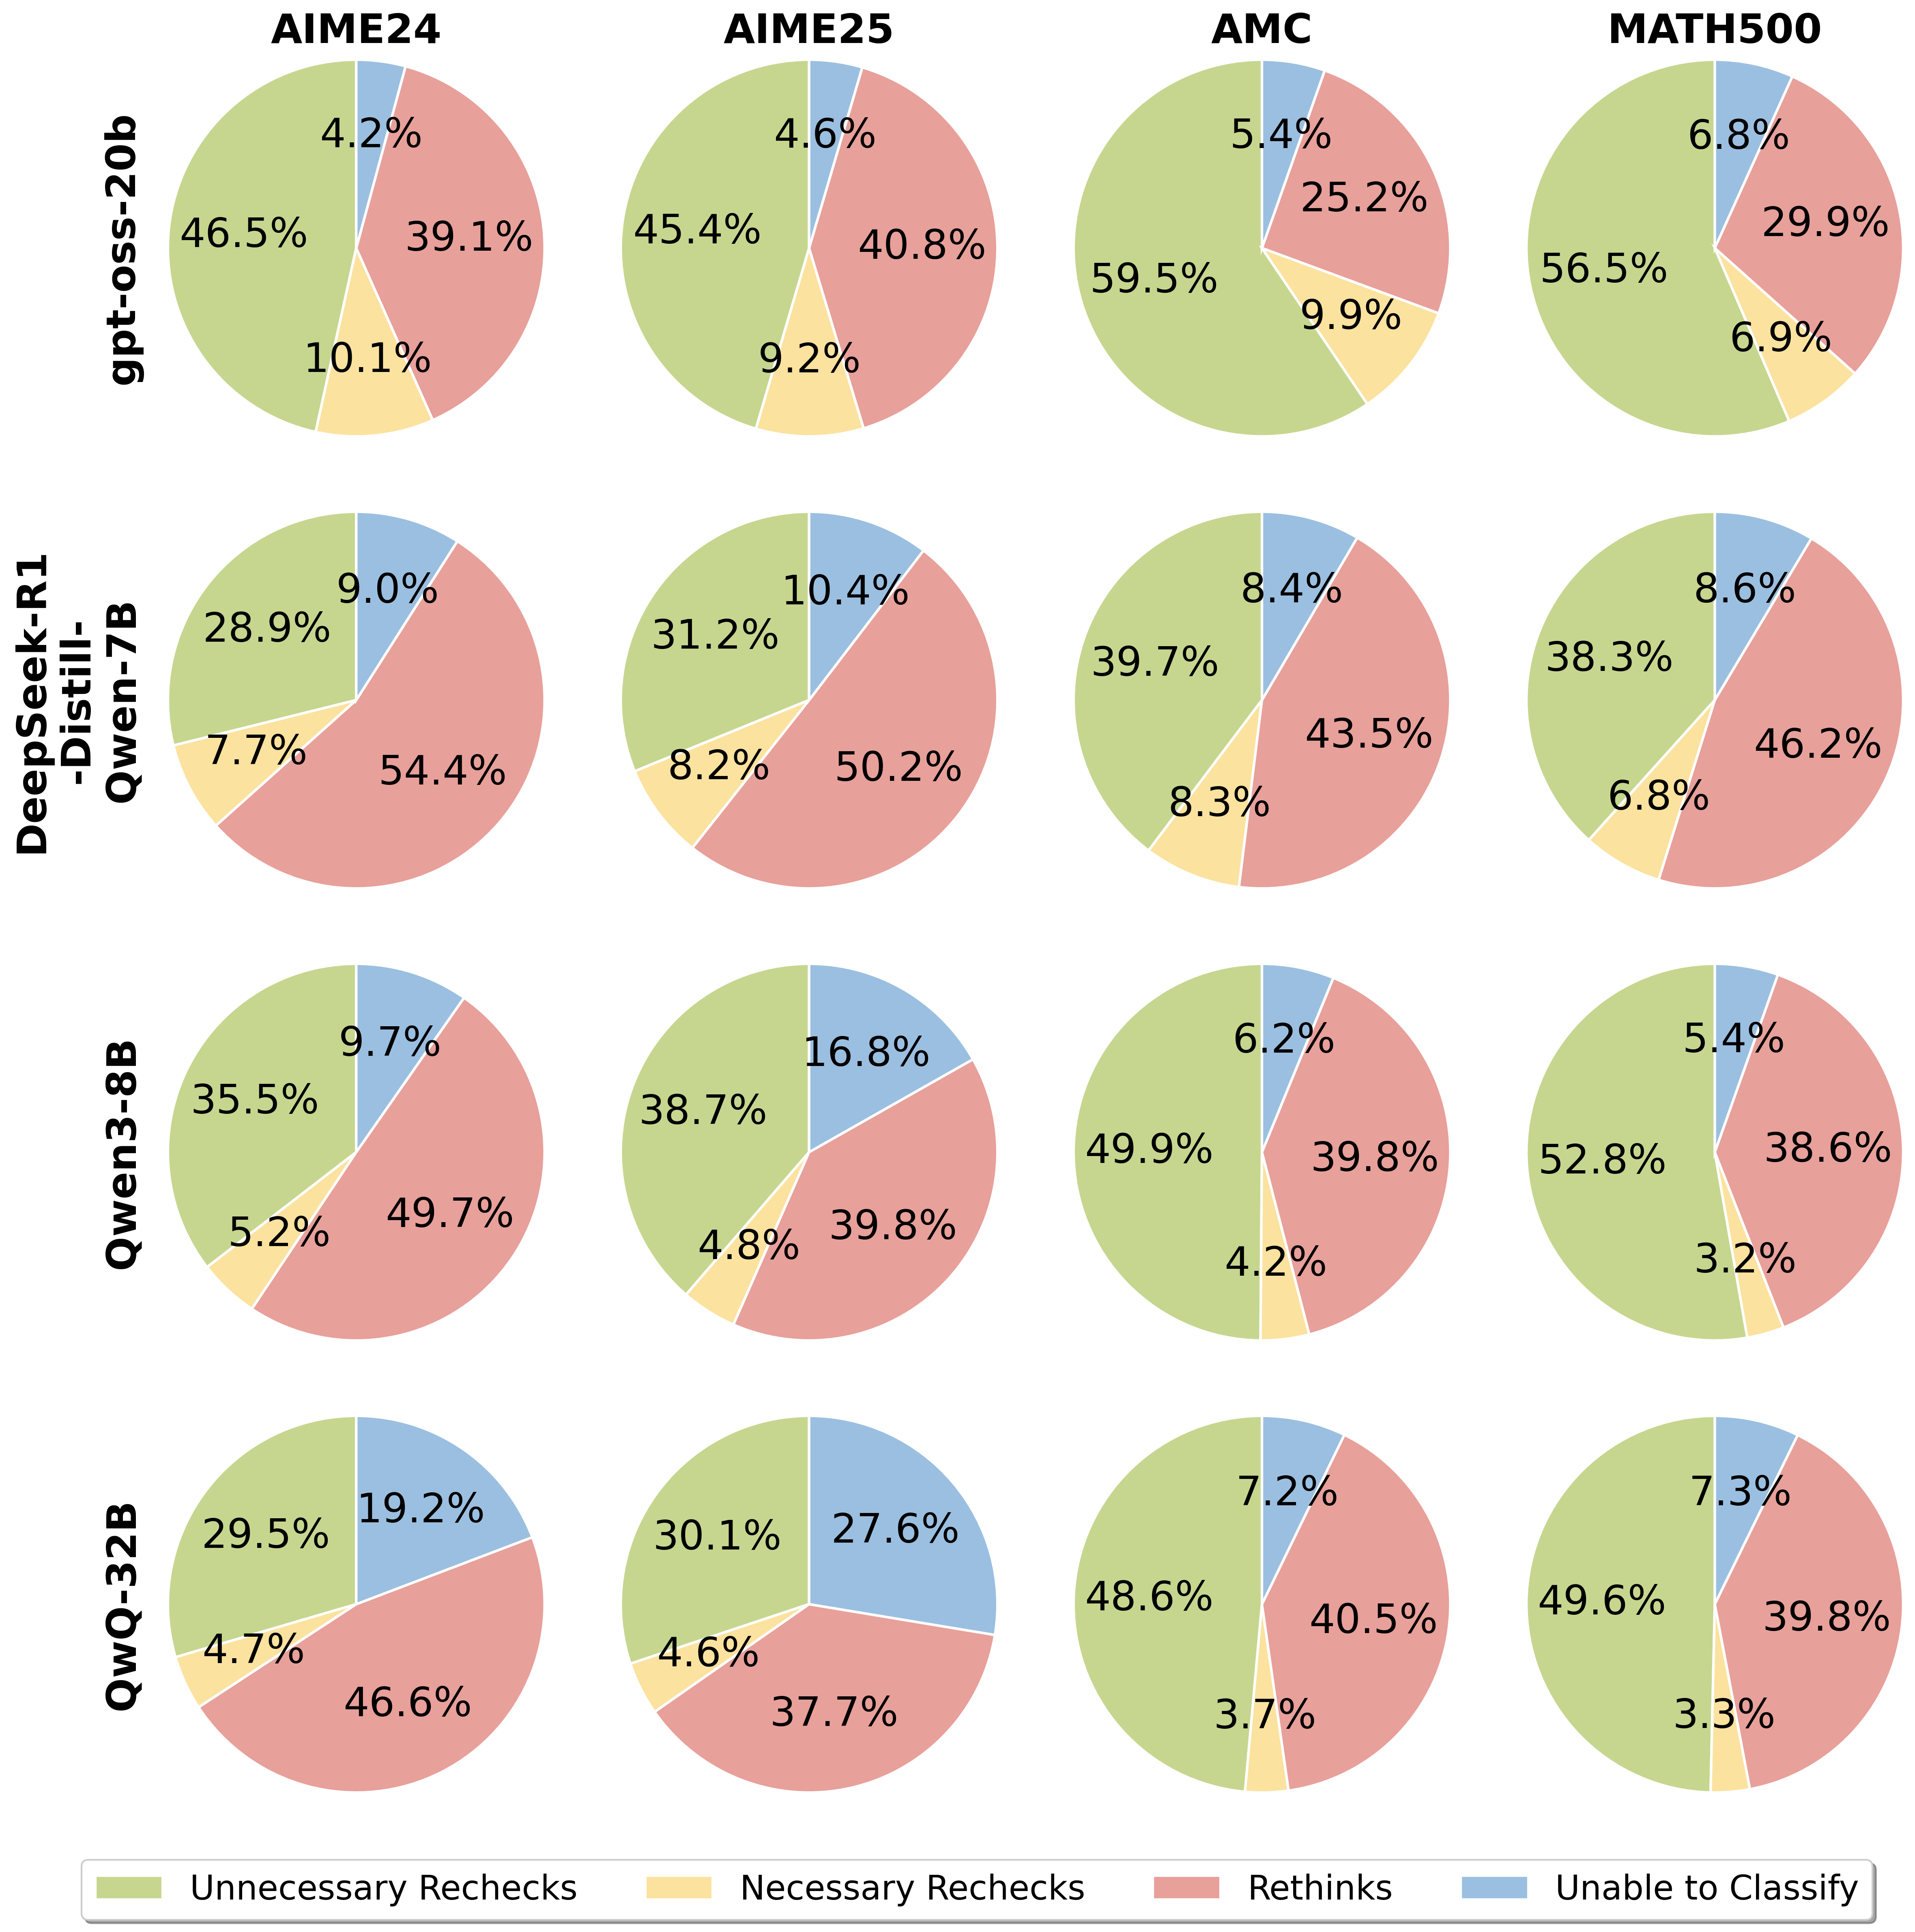
The image displays a 4x4 grid of pie charts analyzing the performance breakdown of four different AI models across four mathematical benchmark datasets. Each pie chart represents the distribution of four outcome categories for a specific model-dataset pair. The overall purpose is to compare how different models allocate their reasoning efforts or errors across these categories.
### Components/Axes
* **Rows (Models):** The vertical axis lists four AI models:
1. `gpt-oss-20b` (Top row)
2. `DeepSeek-R1-Distill-Qwen-7B` (Second row)
3. `Qwen3-8B` (Third row)
4. `QwQ-32B` (Bottom row)
* **Columns (Datasets):** The horizontal axis lists four benchmark datasets:
1. `AIME24` (First column)
2. `AIME25` (Second column)
3. `AMC` (Third column)
4. `MATH500` (Fourth column)
* **Legend:** Located at the bottom of the image, defining the four categories by color:
* **Green:** Unnecessary Rechecks
* **Yellow:** Necessary Rechecks
* **Red:** Rethinks
* **Blue:** Unable to Classify
### Detailed Analysis
The extracted data for each pie chart, organized by model (row) and dataset (column). Percentages are approximate as labeled.
| Model | Dataset | Unnecessary Rechecks (Green) | Necessary Rechecks (Yellow) | Rethinks (Red) | Unable to Classify (Blue) |
| :--- | :--- | :--- | :--- | :--- | :--- |
| **gpt-oss-20b** | AIME24 | 46.5% | 10.1% | 39.1% | 4.2% |
| | AIME25 | 45.4% | 9.2% | 40.8% | 4.6% |
| | AMC | 59.5% | 9.9% | 25.2% | 5.4% |
| | MATH500 | 56.5% | 6.9% | 29.9% | 6.8% |
| **DeepSeek-R1-Distill-Qwen-7B** | AIME24 | 28.9% | 7.7% | 54.4% | 9.0% |
| | AIME25 | 31.2% | 8.2% | 50.2% | 10.4% |
| | AMC | 39.7% | 8.3% | 43.5% | 8.4% |
| | MATH500 | 38.3% | 6.8% | 46.2% | 8.6% |
| **Qwen3-8B** | AIME24 | 35.5% | 5.2% | 49.7% | 9.7% |
| | AIME25 | 38.7% | 4.8% | 39.8% | 16.8% |
| | AMC | 49.9% | 4.2% | 39.8% | 6.2% |
| | MATH500 | 52.8% | 3.2% | 38.6% | 5.4% |
| **QwQ-32B** | AIME24 | 29.5% | 4.7% | 46.6% | 19.2% |
| | AIME25 | 30.1% | 4.6% | 37.7% | 27.6% |
| | AMC | 48.6% | 3.7% | 40.5% | 7.2% |
| | MATH500 | 49.6% | 3.3% | 39.8% | 7.3% |
### Key Observations
1. **Model Behavior:** `gpt-oss-20b` consistently shows the highest proportion of "Unnecessary Rechecks" (green), especially on AMC (59.5%) and MATH500 (56.5%). In contrast, `DeepSeek-R1-Distill-Qwen-7B` has the highest "Rethinks" (red) across all datasets, peaking at 54.4% on AIME24.
2. **Dataset Difficulty:** The "Unable to Classify" (blue) segment is notably larger for the AIME datasets (AIME24, AIME25) compared to AMC and MATH500 for most models, suggesting these benchmarks may present more ambiguous or unclassifiable errors.
3. **Outlier Data Point:** The `QwQ-32B` model on the `AIME25` dataset has an exceptionally high "Unable to Classify" rate of 27.6%, which is the single largest blue segment in the entire grid.
4. **Necessary Rechecks Trend:** The "Necessary Rechecks" (yellow) category is generally the smallest segment for all models, often below 10%. It shows a slight decreasing trend from `gpt-oss-20b` to `QwQ-32B`.
### Interpretation
This visualization provides a diagnostic breakdown of model reasoning processes on mathematical tasks. The categories likely represent different failure modes or internal verification steps.
* **"Unnecessary Rechecks" (Green)** may indicate a model being overly cautious or inefficient, spending compute on verifying correct answers. `gpt-oss-20b` exhibits this trait most strongly.
* **"Rethinks" (Red)** could represent instances where the model identified an error in its initial reasoning and attempted a correction. `DeepSeek-R1-Distill-Qwen-7B` appears most prone to this, suggesting it may make more initial errors but has a robust self-correction mechanism.
* **"Necessary Rechecks" (Yellow)** is a small but critical category, likely representing efficient, correct self-verification. Its low percentage across the board suggests this is a rare optimal behavior.
* **"Unable to Classify" (Blue)** highlights model uncertainty or failure modes that don't fit the primary categories. The spike for `QwQ-32B` on AIME25 indicates a specific weakness or a characteristic of that dataset that confounds this model's reasoning trace.
The data suggests a trade-off: models like `gpt-oss-20b` may be more confident (fewer rethinks) but less efficient (more unnecessary checks), while models like `DeepSeek-R1-Distill-Qwen-7B` engage in more corrective reasoning. The high "Unable to Classify" rates on AIME benchmarks imply these tests probe aspects of reasoning that are difficult for current models to cleanly categorize or execute.