## Line Graph: ΔP Values Across Layers in Mistral-7B Models (v0.1 and v0.3)
### Overview
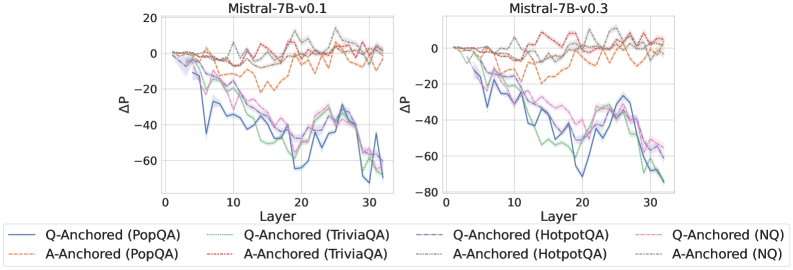
The image contains two side-by-side line graphs comparing ΔP (change in performance?) values across 30 layers of the Mistral-7B model in versions v0.1 (left) and v0.3 (right). Each graph includes six data series representing different anchoring methods (Q-Anchored/A-Anchored) and datasets (PopQA, TriviaQA, HotpotQA, NQ). The y-axis ranges from -80 to 20, while the x-axis spans layers 0–30.
---
### Components/Axes
- **Left Graph**: Mistral-7B-v0.1
- **Right Graph**: Mistral-7B-v0.3
- **Y-Axis**: ΔP (values from -80 to 20)
- **X-Axis**: Layer (0–30)
- **Legend**: Located at the bottom, with six entries:
1. **Q-Anchored (PopQA)**: Solid blue line
2. **A-Anchored (PopQA)**: Dashed orange line
3. **Q-Anchored (TriviaQA)**: Dotted green line
4. **A-Anchored (TriviaQA)**: Dash-dot purple line
5. **Q-Anchored (HotpotQA)**: Solid purple line
6. **A-Anchored (NQ)**: Dashed orange line (note: overlaps with A-Anchored PopQA style)
---
### Detailed Analysis
#### Mistral-7B-v0.1 (Left Graph)
- **Q-Anchored (PopQA)**: Starts at 0, dips to ~-45 at layer 10, recovers to ~-10 by layer 30.
- **A-Anchored (PopQA)**: Starts at ~-5, fluctuates between -10 and 0, ending at ~-5.
- **Q-Anchored (TriviaQA)**: Starts at ~-5, dips to ~-30 at layer 15, recovers to ~-15.
- **A-Anchored (TriviaQA)**: Starts at ~-10, peaks at ~-5 at layer 5, ends at ~-20.
- **Q-Anchored (HotpotQA)**: Starts at ~-5, dips to ~-40 at layer 20, recovers to ~-10.
- **A-Anchored (NQ)**: Starts at ~-5, fluctuates between -10 and 0, ending at ~-5.
#### Mistral-7B-v0.3 (Right Graph)
- **Q-Anchored (PopQA)**: Starts at 0, plunges to ~-60 at layer 15, recovers to ~-20 by layer 30.
- **A-Anchored (PopQA)**: Starts at ~-5, dips to ~-40 at layer 10, fluctuates to ~-10.
- **Q-Anchored (TriviaQA)**: Starts at ~-5, dips to ~-50 at layer 12, recovers to ~-25.
- **A-Anchored (TriviaQA)**: Starts at ~-10, peaks at ~-5 at layer 5, ends at ~-30.
- **Q-Anchored (HotpotQA)**: Starts at ~-5, dips to ~-60 at layer 18, recovers to ~-30.
- **A-Anchored (NQ)**: Starts at ~-5, fluctuates between -10 and 0, ending at ~-5.
---
### Key Observations
1. **Model Version Differences**:
- v0.3 shows more extreme ΔP fluctuations (e.g., Q-Anchored PopQA drops to -60 vs. -45 in v0.1).
- v0.1 trends are smoother, while v0.3 exhibits sharper dips and recoveries.
2. **Anchoring Method Trends**:
- **Q-Anchored** methods generally show deeper ΔP dips (e.g., Q-Anchored PopQA in v0.3 reaches -60).
- **A-Anchored** methods exhibit more stability but smaller magnitude changes.
3. **Dataset-Specific Behavior**:
- **PopQA**: Largest ΔP swings in both versions (e.g., -60 in v0.3).
- **NQ**: Minimal ΔP variation across layers (consistent ~-5 to 0).
4. **Layer-Specific Anomalies**:
- Sharpest dips occur in middle layers (10–20) for most methods.
- v0.3’s Q-Anchored HotpotQA shows a unique U-shaped recovery after layer 20.
---
### Interpretation
- **Performance Implications**: Lower ΔP values (more negative) may indicate better performance, suggesting Q-Anchored methods are more effective in reducing ΔP, particularly in later layers.
- **Model Version Impact**: v0.3’s increased volatility could reflect architectural changes or training adjustments affecting layer-specific behavior.
- **Dataset Sensitivity**: PopQA and TriviaQA show greater sensitivity to anchoring methods, while NQ remains stable, possibly due to dataset complexity or question type.
- **Outliers**: The extreme -60 ΔP in v0.3’s Q-Anchored PopQA at layer 15 may indicate a critical layer adjustment or dataset-specific failure mode.
---
### Spatial Grounding & Legend Verification
- **Legend Placement**: Bottom-center, aligned with x-axis.
- **Color/Style Consistency**: All lines match legend entries (e.g., Q-Anchored PopQA = solid blue).
- **Axis Labels**: Clear and unambiguous (ΔP, Layer).
---
### Content Details
- **Numerical Approximations**:
- v0.1 Q-Anchored PopQA: ~-45 (layer 10), ~-10 (layer 30).
- v0.3 Q-Anchored PopQA: ~-60 (layer 15), ~-20 (layer 30).
- A-Anchored NQ: ~-5 (layers 0/30), ~-10 (layer 15).
- **Trend Verification**:
- Q-Anchored lines generally slope downward then recover.
- A-Anchored lines show smaller amplitude oscillations.
---
### Final Notes
The graphs highlight how anchoring methods and model versions interact to shape layer-specific ΔP values. Further investigation is needed to clarify ΔP’s exact meaning (e.g., performance metric, error rate) and contextualize these findings within the broader model evaluation framework.