TECHNICAL ASSET FINGERPRINT
ee50256dfe2378cf32b4cae9
Click to view fullscreen
Press ESC or click to close
FOUND IN PAPERS
EXPERT: healer-alpha-free VERSION 1
RUNTIME: free/openrouter/healer-alpha
INTEL_VERIFIED
## Line Charts: Comparison of ΔP Across Layers for Mistral-7B Model Versions
### Overview
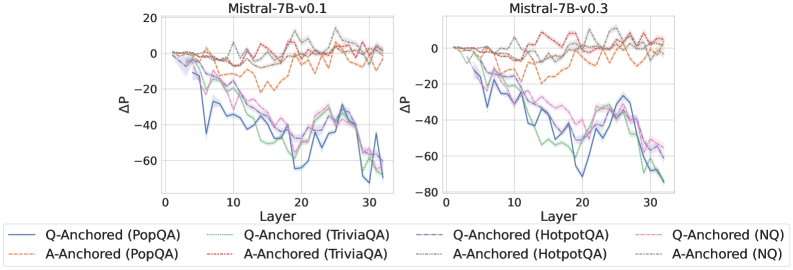
The image displays two side-by-side line charts comparing the change in probability (ΔP) across the 32 layers of two versions of the Mistral-7B language model: "Mistral-7B-v0.1" (left chart) and "Mistral-7B-v0.3" (right chart). Each chart plots eight data series, representing two anchoring methods (Q-Anchored and A-Anchored) applied to four different question-answering datasets (PopQA, TriviaQA, HotpotQA, NQ).
### Components/Axes
* **Chart Titles:** "Mistral-7B-v0.1" (left), "Mistral-7B-v0.3" (right).
* **Y-Axis:** Labeled "ΔP". The scale ranges from -80 to 20, with major tick marks at intervals of 20 (-80, -60, -40, -20, 0, 20).
* **X-Axis:** Labeled "Layer". The scale ranges from 0 to 30, with major tick marks at intervals of 10 (0, 10, 20, 30). The data appears to be plotted for layers 1 through 32.
* **Legend:** Positioned at the bottom, spanning the width of both charts. It defines eight series using a combination of color and line style (solid vs. dashed).
* **Q-Anchored (Solid Lines):**
* Blue: Q-Anchored (PopQA)
* Green: Q-Anchored (TriviaQA)
* Purple: Q-Anchored (HotpotQA)
* Pink: Q-Anchored (NQ)
* **A-Anchored (Dashed Lines):**
* Orange: A-Anchored (PopQA)
* Red: A-Anchored (TriviaQA)
* Gray: A-Anchored (HotpotQA)
* Brown: A-Anchored (NQ)
### Detailed Analysis
**Trend Verification & Data Points (Approximate):**
* **Mistral-7B-v0.1 (Left Chart):**
* **Q-Anchored Series (Solid Lines):** All four solid lines show a pronounced downward trend, indicating a significant negative ΔP as layer depth increases.
* **Q-Anchored (PopQA) - Blue:** Starts near 0 at Layer 1. Drops steeply, reaching approximately -40 by Layer 10, -60 by Layer 20, and fluctuating between -50 and -70 from Layer 25 to 32.
* **Q-Anchored (TriviaQA) - Green:** Follows a very similar trajectory to the blue line, closely overlapping it, especially in deeper layers (20-32), ending near -60.
* **Q-Anchored (HotpotQA) - Purple:** Also follows the steep decline, generally positioned slightly above the blue and green lines in mid-layers (10-20) but converging with them in the deepest layers.
* **Q-Anchored (NQ) - Pink:** Shows the same pattern, often the highest of the solid lines in mid-layers but still dropping to around -50 to -60 by Layer 32.
* **A-Anchored Series (Dashed Lines):** All four dashed lines remain relatively stable, fluctuating around the 0 line with much smaller magnitude changes.
* **A-Anchored (PopQA) - Orange:** Fluctuates mostly between -10 and +10 across all layers.
* **A-Anchored (TriviaQA) - Red:** Similar stable pattern, fluctuating near 0.
* **A-Anchored (HotpotQA) - Gray:** Stable, fluctuating near 0.
* **A-Anchored (NQ) - Brown:** Stable, fluctuating near 0.
* **Mistral-7B-v0.3 (Right Chart):**
* **Q-Anchored Series (Solid Lines):** The same strong downward trend is present, but the magnitude of the negative ΔP appears slightly larger in the deepest layers compared to v0.1.
* **Q-Anchored (PopQA) - Blue:** Declines from 0, reaching approximately -50 by Layer 10, -70 by Layer 20, and fluctuating between -60 and -80 from Layer 25 to 32.
* **Q-Anchored (TriviaQA) - Green:** Closely tracks the blue line, ending in the -60 to -80 range.
* **Q-Anchored (HotpotQA) - Purple:** Follows the decline, often slightly above the blue/green lines, ending near -60.
* **Q-Anchored (NQ) - Pink:** Similar pattern, ending near -60.
* **A-Anchored Series (Dashed Lines):** Continue to show stability around 0, with no significant downward trend.
* **A-Anchored (PopQA) - Orange:** Fluctuates near 0.
* **A-Anchored (TriviaQA) - Red:** Fluctuates near 0.
* **A-Anchored (HotpotQA) - Gray:** Fluctuates near 0.
* **A-Anchored (NQ) - Brown:** Fluctuates near 0.
### Key Observations
1. **Fundamental Dichotomy:** There is a stark and consistent contrast between the behavior of Q-Anchored (solid lines) and A-Anchored (dashed lines) methods across both model versions and all four datasets.
2. **Layer-Dependent Degradation for Q-Anchored:** The Q-Anchored methods exhibit a strong, monotonic decrease in ΔP as the layer number increases. The most significant drops occur between layers 5-20, with values stabilizing at a large negative magnitude in the final 10 layers.
3. **Stability of A-Anchored:** The A-Anchored methods show no such layer-dependent degradation. Their ΔP values oscillate within a narrow band (approximately ±15) around zero throughout the network depth.
4. **Dataset Similarity:** Within each anchoring method group (Q or A), the four lines for different datasets (PopQA, TriviaQA, HotpotQA, NQ) follow remarkably similar trajectories, suggesting the observed effect is driven primarily by the anchoring method, not the specific dataset.
5. **Model Version Comparison:** The overall pattern is nearly identical between Mistral-7B-v0.1 and v0.3. However, the negative ΔP for Q-Anchored methods in the final layers (25-32) appears slightly more severe (reaching closer to -80) in the v0.3 chart.
### Interpretation
This visualization demonstrates a critical finding related to how language models process information internally, specifically concerning "anchoring" to either the question (Q) or the answer (A).
* **What the Data Suggests:** The ΔP metric likely measures a change in the model's probability assignment or internal representation confidence. The steep negative trend for Q-Anchored methods implies that as information propagates through the network's layers, the model's processing anchored to the *question* leads to a significant and progressive reduction in this probability metric. In contrast, anchoring to the *answer* maintains a stable probability signal throughout the network.
* **Relationship Between Elements:** The charts isolate the effect of two variables: **Model Version** (v0.1 vs. v0.3) and **Anchoring Method** (Q vs. A). The primary driver of the ΔP trend is the anchoring method. The model version has a minor, secondary effect on the magnitude of the Q-Anchored degradation. The dataset appears to be a negligible factor in this specific comparison.
* **Notable Anomalies/Patterns:** The most striking pattern is the perfect separation of the two method groups. There is no overlap between the solid and dashed line clusters after the first few layers. This suggests a fundamental difference in how the model's internal computations evolve when conditioned on the question versus the answer. The consistency across four diverse QA datasets reinforces that this is a general model behavior, not an artifact of a specific data distribution.
* **Implication (Reading Between the Lines):** This could indicate that the model's internal "reasoning" or representation pathway diverges significantly based on the anchoring point. The Q-Anchored pathway may involve a process of evidence accumulation or hypothesis testing that results in a downward adjustment of probabilities, while the A-Anchored pathway might involve verification or reinforcement, leading to stability. The slight increase in degradation from v0.1 to v0.3 could suggest that model updates, while potentially improving overall performance, might amplify this internal representational dynamic.
DECODING INTELLIGENCE...