\n
## Histogram: Distribution of Thinking Tokens
### Overview
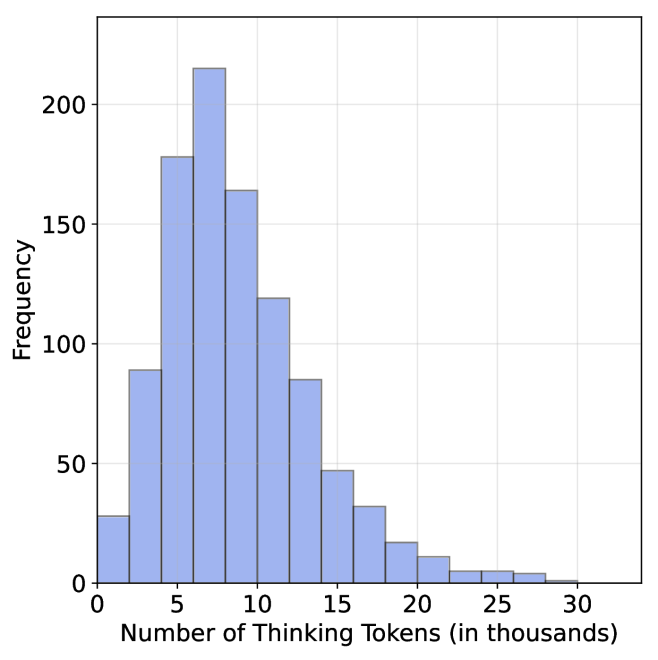
The image presents a histogram visualizing the frequency distribution of "Thinking Tokens" measured in thousands. The data appears to be approximately normally distributed, with a peak around 8-10 thousand tokens.
### Components/Axes
* **X-axis:** "Number of Thinking Tokens (in thousands)". Scale ranges from 0 to 30, with tick marks at 0, 5, 10, 15, 20, 25, and 30.
* **Y-axis:** "Frequency". Scale ranges from 0 to 200, with tick marks at 0, 50, 100, 150, and 200.
* **Histogram Bars:** Represent the frequency of observations within specific bins of "Thinking Tokens". The bars are filled with a light blue color.
* **Gridlines:** A light gray grid is present in the background to aid in reading values.
### Detailed Analysis
The histogram shows the following approximate frequencies for each bin:
* 0-2 thousand tokens: Frequency ≈ 90
* 2-4 thousand tokens: Frequency ≈ 180
* 4-6 thousand tokens: Frequency ≈ 170
* 6-8 thousand tokens: Frequency ≈ 210
* 8-10 thousand tokens: Frequency ≈ 220
* 10-12 thousand tokens: Frequency ≈ 160
* 12-14 thousand tokens: Frequency ≈ 90
* 14-16 thousand tokens: Frequency ≈ 40
* 16-18 thousand tokens: Frequency ≈ 20
* 18-20 thousand tokens: Frequency ≈ 10
* 20-22 thousand tokens: Frequency ≈ 5
* 22-24 thousand tokens: Frequency ≈ 2
* 24-26 thousand tokens: Frequency ≈ 1
* 26-28 thousand tokens: Frequency ≈ 0
* 28-30 thousand tokens: Frequency ≈ 0
The distribution is unimodal, peaking between 8 and 10 thousand tokens. The data tapers off symmetrically on both sides of the peak.
### Key Observations
* The majority of observations fall between 4 and 14 thousand tokens.
* There is a relatively small number of observations with very high or very low token counts.
* The distribution appears to be approximately symmetrical.
### Interpretation
This histogram likely represents the distribution of the number of tokens used during a "thinking" process, potentially in a language model or cognitive task. The peak around 8-10 thousand tokens suggests that this is the typical amount of processing done in such tasks. The relatively symmetrical distribution indicates that the process is consistent across different instances. The long tail on the right suggests that some tasks require significantly more tokens than others, potentially due to complexity or ambiguity. The data suggests a central tendency around 8-10k tokens, with a spread indicating variability in the cognitive load or processing requirements of different tasks. The absence of data points beyond 26k tokens suggests a practical or technical limit to the number of tokens considered.