This document provides a detailed technical extraction and analysis of the provided image, which contains two distinct charts labeled (a) and (b).
## Charts: Power and Energy Consumption Analysis
### Overview
The image displays two side-by-side charts comparing performance metrics across different tasks and hardware configurations.
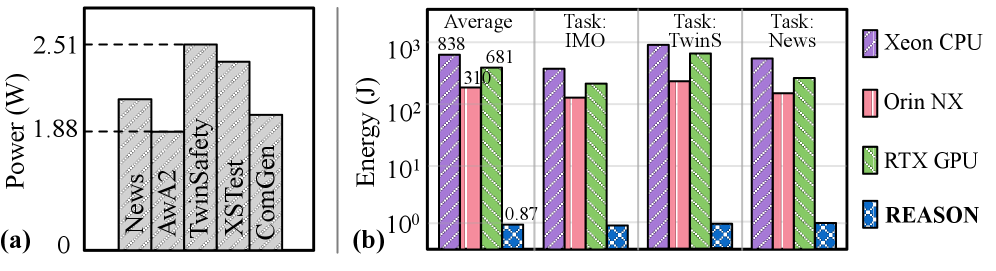
* **Chart (a)** is a bar chart illustrating the **Power (W)** consumption for five specific tasks/datasets.
* **Chart (b)** is a grouped bar chart illustrating the **Energy (J)** consumption on a logarithmic scale for four categories (Average and three specific tasks) across four hardware/software configurations.
---
### Components/Axes
#### Chart (a) - Left
* **Y-Axis:** Power (W). The scale is linear, starting at 0. There are two horizontal dashed reference lines at 1.88 W and 2.51 W.
* **X-Axis:** Categorical labels: "News", "AwA2", "TwinSafety", "XSTest", "ComGen".
* **Data Series:** Single series of grey bars with diagonal hatching.
#### Chart (b) - Right
* **Y-Axis:** Energy (J). The scale is logarithmic, ranging from $10^0$ to $10^3$.
* **X-Axis:** Categorical groups: "Average", "Task: IMO", "Task: TwinS", "Task: News".
* **Legend (Far Right):**
* **Purple (Diagonal Hatch):** Xeon CPU
* **Pink (Vertical Lines):** Orin NX
* **Green (Diagonal Hatch):** RTX GPU
* **Blue (Grid/Cross-hatch):** REASON
* **Data Series:** Four grouped bars per category, corresponding to the legend above.
---
### Detailed Analysis
#### Chart (a): Power (W)
The bars represent the power draw for specific tasks.
* **News:** Approximately 2.0 W.
* **AwA2:** Exactly 1.88 W (aligns with the lower dashed reference line).
* **TwinSafety:** Exactly 2.51 W (aligns with the upper dashed reference line).
* **XSTest:** Approximately 2.4 W (slightly below the 2.51 W line).
* **ComGen:** Approximately 1.95 W (slightly above the 1.88 W line).
#### Chart (b): Energy (J)
This chart uses a logarithmic scale. The values are estimated based on the visual position relative to the grid lines ($10^0=1, 10^1=10, 10^2=100, 10^3=1000$).
| Category | Xeon CPU (Purple) | Orin NX (Pink) | RTX GPU (Green) | REASON (Blue) |
| :--- | :--- | :--- | :--- | :--- |
| **Average** | ~838 J | ~310 J | ~681 J | ~0.87 J |
| **Task: IMO** | ~500 J | ~180 J | ~300 J | ~1.0 J |
| **Task: TwinS** | ~1200 J | ~350 J | ~900 J | ~1.0 J |
| **Task: News** | ~750 J | ~220 J | ~400 J | ~1.0 J |
*Note: The "REASON" bars are consistently very low, hovering near the $10^0$ (1 Joule) mark, whereas the hardware components (Xeon, Orin, RTX) operate in the $10^2$ to $10^3$ Joule range.*
---
### Key Observations
1. **Hardware Hierarchy:** In Chart (b), the Xeon CPU consistently consumes the most energy across all tasks, followed by the RTX GPU, and then the Orin NX.
2. **Efficiency Gap:** There is a massive disparity between the hardware components and "REASON." While the hardware components consume energy in the hundreds of Joules, "REASON" consumes energy at or below 1 Joule. This represents an efficiency improvement of roughly 2 to 3 orders of magnitude.
3. **Task Intensity:** "Task: TwinS" is the most energy-intensive task across all hardware platforms (Xeon, Orin, RTX), while "Task: IMO" appears to be the least energy-intensive.
---
### Interpretation
The data demonstrates a significant optimization or efficiency advantage provided by "REASON" compared to standard hardware implementations (Xeon CPU, Orin NX, RTX GPU).
* **Reading between the lines:** The logarithmic scale in Chart (b) is necessary because the energy consumption of the hardware components is so vastly higher than that of "REASON" that they would not be comparable on a linear scale.
* **Peircean Investigative View:** The juxtaposition of Power (W) in chart (a) and Energy (J) in chart (b) suggests that while the power draw of the tasks is relatively constrained (between ~1.8W and ~2.5W), the *total energy* required to complete these tasks varies wildly depending on the underlying architecture. The "REASON" component likely represents a highly optimized software or algorithmic approach that completes the tasks significantly faster or with far less computational overhead than the hardware-bound processes, resulting in the drastic reduction in total energy (Joules = Watts × Time).