\n
## Bar Charts: Power Consumption and Energy Usage
### Overview
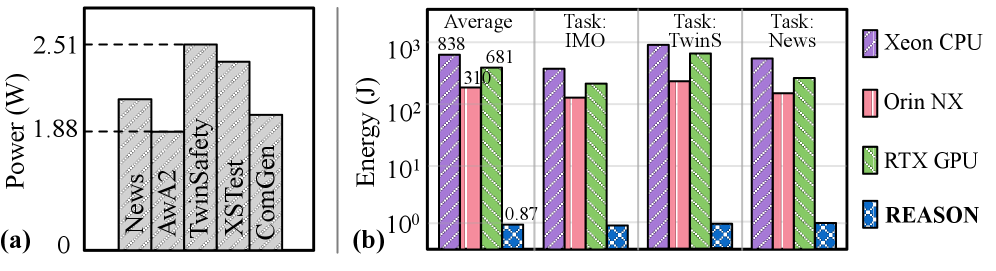
The image presents two bar charts: (a) power consumption in Watts (W) for different tasks, and (b) energy usage in Joules (J) for the same tasks across different hardware platforms. The tasks are News, AwA2, TwinSafety, XSTest, and ComGen. The hardware platforms are Xeon CPU, Orin NX, RTX GPU, and REASON.
### Components/Axes
**Chart (a): Power Consumption**
* **X-axis:** Tasks - News, AwA2, TwinSafety, XSTest, ComGen
* **Y-axis:** Power (W) - Scale ranges from approximately 0 to 2.51.
* **Bars:** Represent power consumption for each task.
**Chart (b): Energy Usage**
* **X-axis:** Tasks - Average, Task: IMO, Task: TwinS, Task: News
* **Y-axis:** Energy (J) - Logarithmic scale, ranging from approximately 1 to 1000.
* **Bars:** Represent energy consumption for each task and hardware platform.
* **Legend:**
* Xeon CPU (Purple)
* Orin NX (Pink/Red)
* RTX GPU (Green)
* REASON (Blue)
### Detailed Analysis or Content Details
**Chart (a): Power Consumption**
* **News:** Approximately 1.88 W.
* **AwA2:** Approximately 2.05 W.
* **TwinSafety:** Approximately 2.25 W.
* **XSTest:** Approximately 2.35 W.
* **ComGen:** Approximately 2.51 W.
* The power consumption generally increases from News to ComGen.
**Chart (b): Energy Usage**
* **Average:**
* Xeon CPU: Approximately 838 J.
* Orin NX: Approximately 310 J.
* RTX GPU: Approximately 681 J.
* REASON: Approximately 0.87 J.
* **Task: IMO:**
* Xeon CPU: Approximately 650 J.
* Orin NX: Approximately 250 J.
* RTX GPU: Approximately 550 J.
* REASON: Approximately 0.75 J.
* **Task: TwinS:**
* Xeon CPU: Approximately 950 J.
* Orin NX: Approximately 350 J.
* RTX GPU: Approximately 850 J.
* REASON: Approximately 1 J.
* **Task: News:**
* Xeon CPU: Approximately 600 J.
* Orin NX: Approximately 200 J.
* RTX GPU: Approximately 500 J.
* REASON: Approximately 0.8 J.
The energy usage varies significantly across tasks and hardware platforms. The Y-axis is logarithmic, so differences appear less pronounced than they are.
### Key Observations
* The Xeon CPU consistently consumes the most energy across all tasks.
* REASON consistently consumes the least energy across all tasks.
* The RTX GPU generally consumes more energy than the Orin NX, except for the TwinS task.
* Energy consumption for the TwinS task is the highest overall.
* The logarithmic scale on the Y-axis of Chart (b) compresses the differences in energy consumption.
### Interpretation
The data suggests that the Xeon CPU is the most energy-intensive platform, while REASON is the most energy-efficient. The RTX GPU offers a balance between performance and energy consumption, generally falling between the Xeon CPU and Orin NX. The TwinS task appears to be the most demanding in terms of energy usage.
The relationship between the two charts is that power consumption (Chart a) contributes to energy usage (Chart b). Energy is power multiplied by time. The tasks with higher power consumption will likely have higher energy usage, assuming similar execution times. The logarithmic scale in Chart (b) highlights the relative differences in energy consumption, making it easier to compare the efficiency of different hardware platforms. The large differences in energy consumption between REASON and the other platforms suggest that REASON is significantly more efficient for these tasks. The fact that the TwinS task has the highest energy consumption suggests it is the most computationally intensive of the tasks tested.