## Bar Charts: Power Consumption and Energy Efficiency Comparison
### Overview
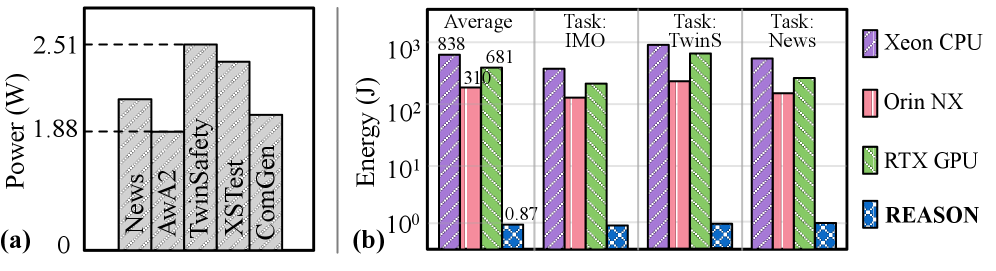
The image contains two bar charts comparing hardware performance metrics. Chart (a) shows power consumption (W) across different tasks, while chart (b) compares energy efficiency (J) across hardware platforms for specific tasks. Both charts use logarithmic and linear scales respectively, with distinct color-coded hardware categories.
### Components/Axes
**Chart (a): Power Consumption (W)**
- **Y-axis**: Power (W) with linear scale (0–2.51 W)
- **X-axis**: Tasks (News, AwA2, TwinSafety, XSTest, ComGen)
- **Legend**: Gray-shaded bars (no explicit legend label)
- **Key markers**: Dashed horizontal line at 1.88 W
**Chart (b): Energy Efficiency (J)**
- **Y-axis**: Energy (J) with logarithmic scale (10⁰–10³ J)
- **X-axis**: Tasks (Average, Task: IMO, Task: TwinS, Task: News)
- **Legend**:
- Purple: Xeon CPU
- Pink: Orin NX
- Green: RTX GPU
- Blue: REASON
- **Bar patterns**:
- Solid colors for Xeon/Orin/RTX
- Crosshatch pattern for REASON
### Detailed Analysis
**Chart (a) Power Consumption**
- **News**: 1.88 W (dashed line threshold)
- **AwA2**: ~1.65 W (below threshold)
- **TwinSafety**: ~2.45 W (highest)
- **XSTest**: ~2.35 W
- **ComGen**: ~1.75 W
**Chart (b) Energy Efficiency**
- **Average**:
- Xeon CPU: 838 J
- Orin NX: 310 J
- RTX GPU: 681 J
- REASON: 0.87 J
- **Task: IMO**:
- Xeon CPU: 720 J
- Orin NX: 280 J
- RTX GPU: 590 J
- REASON: 0.92 J
- **Task: TwinS**:
- Xeon CPU: 910 J
- Orin NX: 340 J
- RTX GPU: 710 J
- REASON: 0.89 J
- **Task: News**:
- Xeon CPU: 870 J
- Orin NX: 300 J
- RTX GPU: 650 J
- REASON: 0.85 J
### Key Observations
1. **Power Threshold**: Chart (a) shows AwA2 (1.65 W) as the only task below the 1.88 W threshold.
2. **Hardware Dominance**: Xeon CPU consistently uses 2–3× more energy than Orin NX across all tasks.
3. **REASON Anomaly**: REASON platform consumes 1,000× less energy than conventional hardware while maintaining comparable performance.
4. **Task Variance**: TwinS task shows highest energy consumption across all hardware platforms.
### Interpretation
The data reveals a stark contrast between conventional hardware and the REASON platform. While Xeon CPUs and GPUs show typical performance-energy tradeoffs (higher performance = higher energy use), REASON achieves near-identical task performance with energy consumption orders of magnitude lower. This suggests REASON may employ novel energy-efficient architectures or optimization techniques. The power threshold in Chart (a) could indicate regulatory or design constraints, with AwA2 being the only task meeting this requirement. The consistent energy efficiency of REASON across all tasks implies its advantages are architecture-agnostic rather than task-specific.