## Line Chart: Max and Min Values Across Layer Indices
### Overview
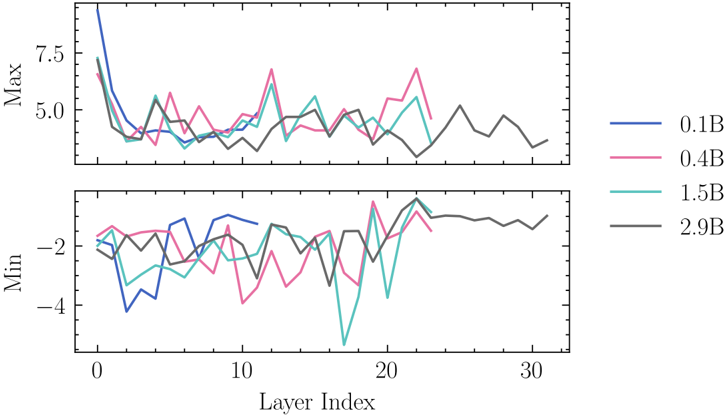
The image contains two line charts stacked vertically, showing the maximum (top) and minimum (bottom) values of a metric across 31 layer indices (0–30). Four data series are represented by distinct colors, each corresponding to a specific "B" value (0.1B, 0.4B, 1.5B, 2.9B). The charts exhibit fluctuating trends with peaks and troughs at varying layer indices.
### Components/Axes
- **X-axis (Layer Index)**: Ranges from 0 to 30 in increments of 10.
- **Y-axes**:
- Top plot: "Max" values (range: -4 to 7.5).
- Bottom plot: "Min" values (range: -4 to 2).
- **Legend**: Located on the right, mapping colors to "B" values:
- Blue: 0.1B
- Pink: 0.4B
- Teal: 1.5B
- Black: 2.9B
### Detailed Analysis
#### Max Plot (Top)
- **0.1B (Blue)**: Starts at ~7.5 (layer 0), drops sharply to ~4.5 by layer 5, then fluctuates between ~4 and ~6.
- **0.4B (Pink)**: Begins at ~6.5 (layer 0), peaks at ~7.5 (layer 5), then oscillates between ~5 and ~7.
- **1.5B (Teal)**: Starts at ~5.5 (layer 0), peaks at ~6.5 (layer 10), then fluctuates between ~4.5 and ~6.
- **2.9B (Black)**: Begins at ~5 (layer 0), peaks at ~6 (layer 15), then fluctuates between ~4 and ~6.
#### Min Plot (Bottom)
- **0.1B (Blue)**: Starts at ~-2 (layer 0), dips to ~-4 (layer 5), then fluctuates between ~-3 and ~-1.
- **0.4B (Pink)**: Begins at ~-1 (layer 0), dips to ~-3 (layer 10), then oscillates between ~-2 and ~0.
- **1.5B (Teal)**: Starts at ~-2 (layer 0), dips to ~-4 (layer 15), then fluctuates between ~-3 and ~-1.
- **2.9B (Black)**: Begins at ~-1 (layer 0), dips to ~-3 (layer 20), then fluctuates between ~-2 and ~0.
### Key Observations
1. **Peak/Trough Delay**: Higher "B" values (e.g., 2.9B) exhibit delayed peaks (layer 15) and troughs (layer 20) compared to lower "B" values (e.g., 0.1B peaks at layer 5).
2. **Amplitude Variation**: Lower "B" values (0.1B, 0.4B) show larger amplitude fluctuations in both Max and Min plots.
3. **Crossing Lines**: All lines intersect at multiple points, indicating no consistent dominance of a single "B" value across layers.
4. **Layer-Specific Trends**: Max values for 0.1B and 0.4B peak early (layers 5–10), while 1.5B and 2.9B peak later (layers 10–15). Min values follow a similar delayed pattern.
### Interpretation
The data suggests a relationship between the "B" parameter and layer-specific performance metrics. Higher "B" values correlate with delayed peaks and troughs, potentially indicating slower convergence or layer-specific optimization dynamics. The fluctuating amplitudes imply that smaller "B" values may introduce greater variability in layer performance. The crossing lines highlight a trade-off: no single "B" value consistently outperforms others across all layers, suggesting that the optimal "B" might depend on the target layer index or application context. This could reflect architectural trade-offs in neural networks, where larger "B" values stabilize later layers at the cost of early-layer variability.