# Technical Document Extraction: Control Value Over Time
## Chart Title
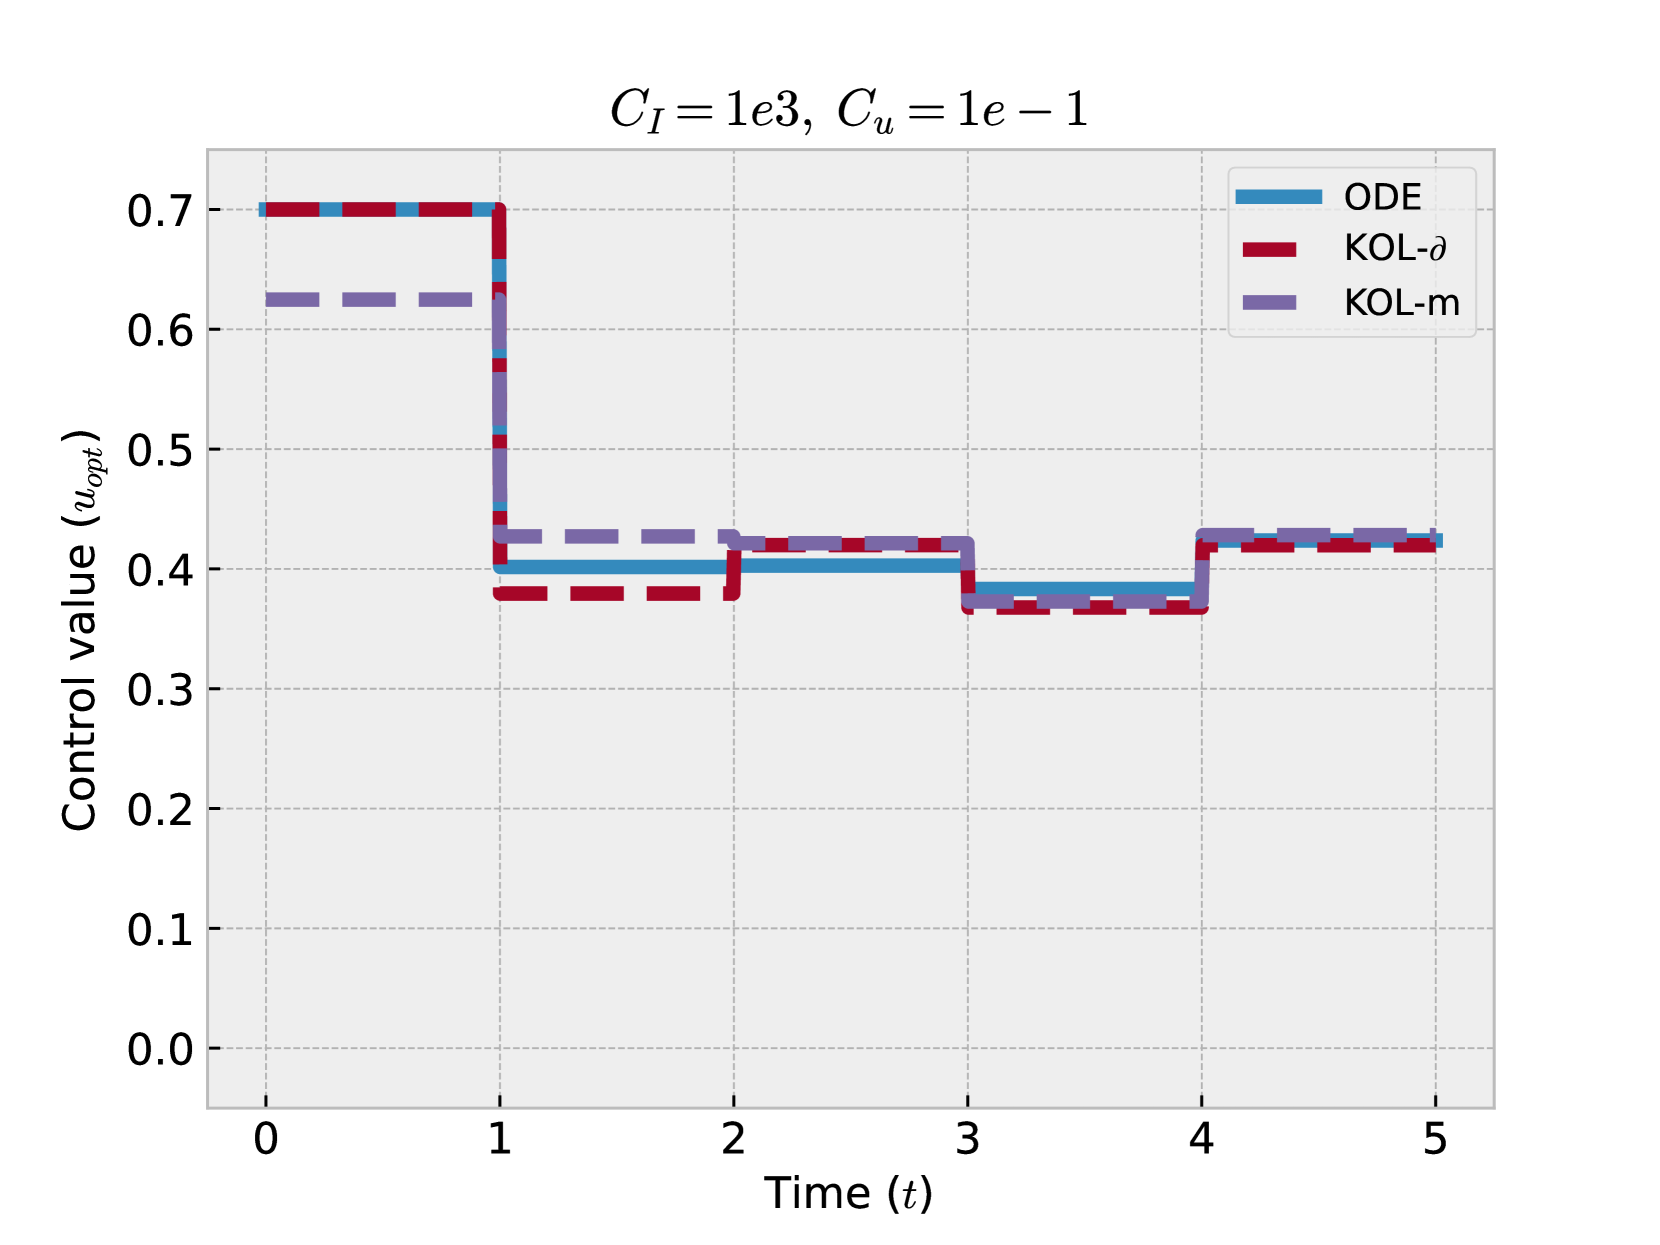
- **Title**: Control Value (u_opt) vs Time (t)
- **Parameters**:
- \( C_I = 1e3 \)
- \( C_u = 1e-1 \)
## Axes
- **X-axis (Time, t)**:
- Range: 0 to 5
- Ticks: 0, 1, 2, 3, 4, 5
- **Y-axis (Control Value, u_opt)**:
- Range: 0.0 to 0.7
- Ticks: 0.0, 0.1, 0.2, 0.3, 0.4, 0.5, 0.6, 0.7
## Legend
- **ODE**: Blue solid line
- **KOL-δ**: Red dashed line
- **KOL-m**: Purple dash-dot line
## Key Trends and Data Points
1. **ODE (Blue)**:
- Starts at **0.7** at \( t = 0 \).
- Drops sharply to **0.4** at \( t = 1 \).
- Remains constant at **0.4** until \( t = 3 \).
- Rises slightly to **0.45** at \( t = 5 \).
2. **KOL-δ (Red)**:
- Starts at **0.6** at \( t = 0 \).
- Drops to **0.4** at \( t = 1 \).
- Remains constant at **0.4** until \( t = 3 \).
- Rises to **0.45** at \( t = 5 \).
3. **KOL-m (Purple)**:
- Starts at **0.6** at \( t = 0 \).
- Drops to **0.4** at \( t = 1 \).
- Remains constant at **0.4** until \( t = 3 \).
- Rises to **0.45** at \( t = 5 \).
## Convergence
- All three control strategies converge to **0.45** at \( t = 5 \).
## Observations
- **ODE** exhibits the most significant initial drop.
- **KOL-δ** and **KOL-m** show identical behavior after \( t = 1 \).
- All strategies stabilize near **0.45** by \( t = 5 \).