# Technical Document Extraction: Line Graph Analysis
## Image Description
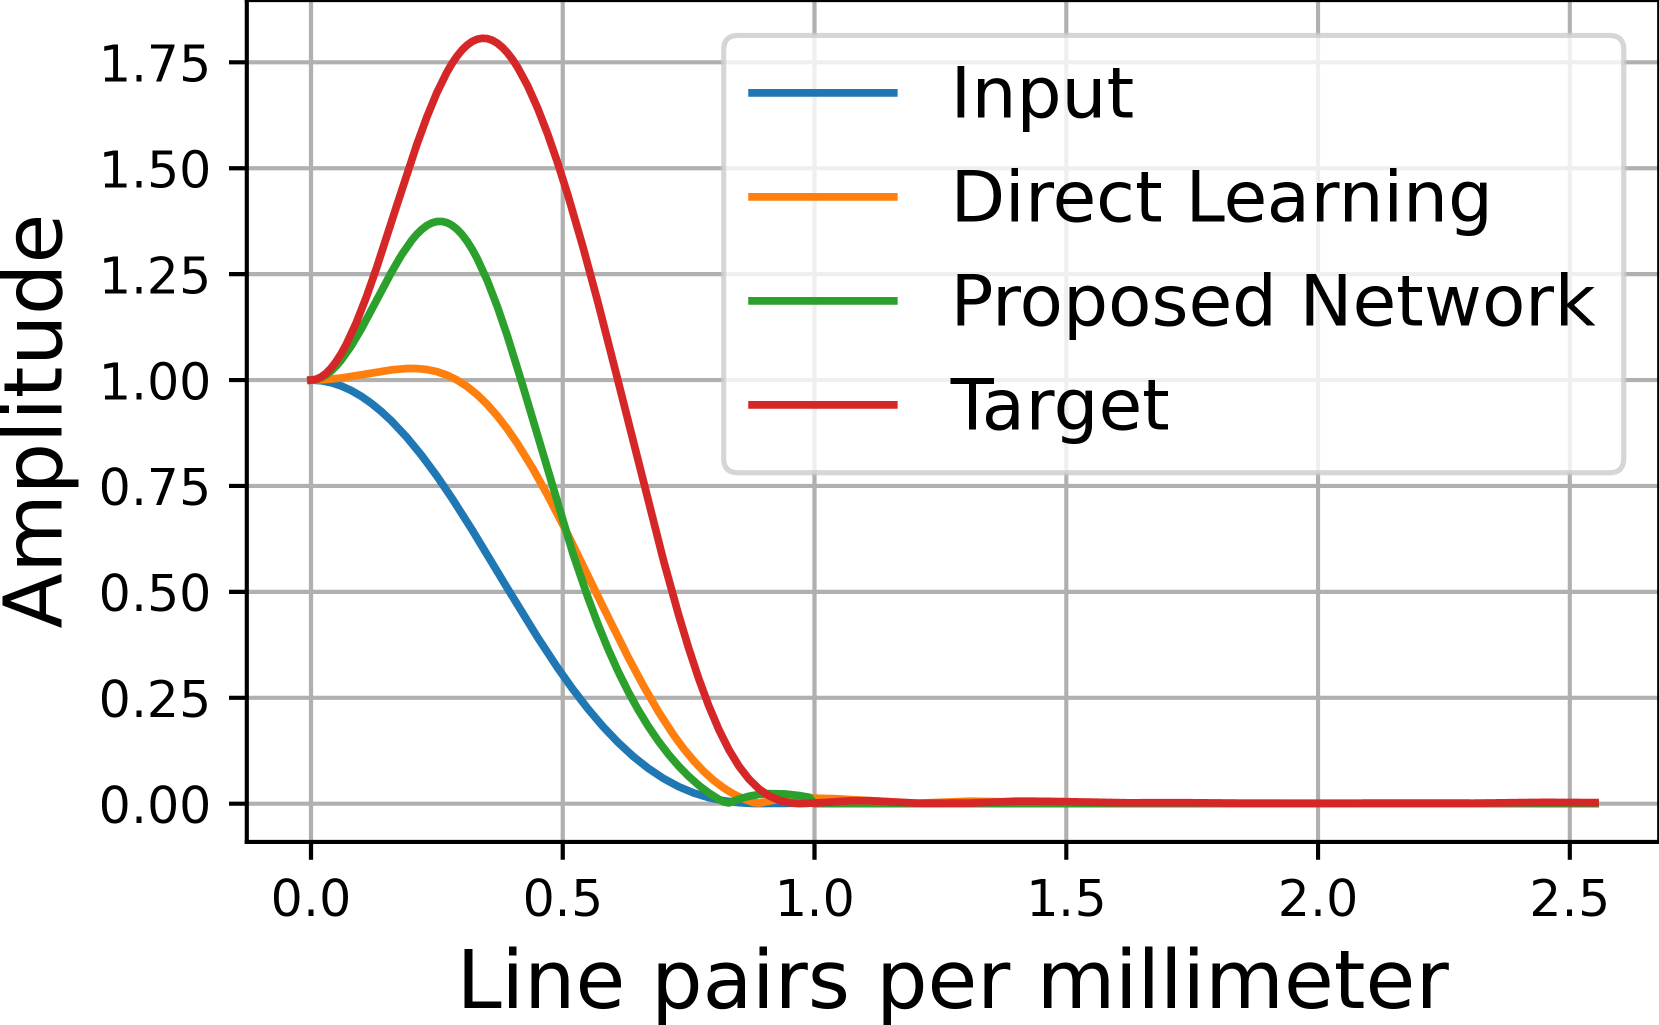
The image is a line graph comparing four data series across a logarithmic scale. The graph features four distinct colored lines representing different datasets, with a legend positioned in the top-right corner outside the plot area.
## Axis Labels and Markers
- **X-axis**: "Line pairs per millimeter" (logarithmic scale)
- Range: 0.0 to 2.5
- Increment: 0.5 units
- **Y-axis**: "Amplitude"
- Range: 0.00 to 1.75
- Increment: 0.25 units
## Legend
- **Position**: Top-right corner (outside plot area)
- **Entries**:
1. **Blue**: Input
2. **Orange**: Direct Learning
3. **Green**: Proposed Network
4. **Red**: Target
## Data Series Analysis
### 1. Input (Blue Line)
- **Trend**: Monotonically decreasing from 1.0 amplitude at x=0.0 to 0.0 at x=1.0
- **Key Points**:
- [0.0, 1.0]
- [0.5, 0.25]
- [1.0, 0.0]
### 2. Direct Learning (Orange Line)
- **Trend**: Initial rise to 1.25 amplitude at x≈0.3, then sharp decline to 0.0 at x=1.0
- **Key Points**:
- [0.0, 1.0]
- [0.3, 1.25]
- [1.0, 0.0]
### 3. Proposed Network (Green Line)
- **Trend**: Slightly higher peak than Input (1.5 amplitude at x≈0.4), then rapid decline to 0.0 at x=1.0
- **Key Points**:
- [0.0, 1.0]
- [0.4, 1.5]
- [1.0, 0.0]
### 4. Target (Red Line)
- **Trend**: Highest peak (1.75 amplitude at x≈0.3), then steep decline to 0.0 at x=1.0
- **Key Points**:
- [0.0, 1.0]
- [0.3, 1.75]
- [1.0, 0.0]
## Post-X=1.0 Behavior
All data series converge to 0 amplitude and remain flat at y=0 for x > 1.0.
## Validation Checks
1. **Color Consistency**: All legend colors match corresponding lines in the plot
2. **Trend Verification**:
- Input shows strict monotonic decrease
- Direct Learning and Proposed Network exhibit single-peak behavior
- Target demonstrates highest peak amplitude
3. **Axis Alignment**: All data points align with logarithmic x-axis scaling
## Conclusion
The graph illustrates comparative performance metrics across four datasets, with the Target dataset demonstrating the highest initial amplitude and fastest convergence to baseline. The Proposed Network shows intermediate performance between Input and Target datasets.