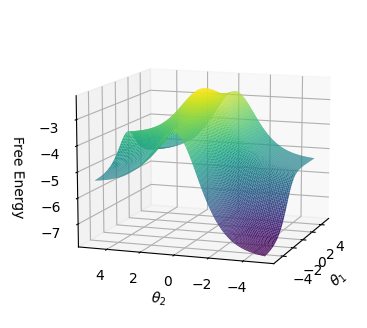
## 3D Surface Plot: Free Energy vs. θ1 and θ2
### Overview
The image is a 3D surface plot visualizing the relationship between Free Energy and two variables, θ1 and θ2. The surface is colored to represent the magnitude of the Free Energy, with cooler colors (purple/blue) indicating lower energy and warmer colors (yellow/green) indicating higher energy. The plot shows a saddle-like shape, suggesting a minimum along one axis and a maximum along the other.
### Components/Axes
* **Vertical Axis (y-axis):** "Free Energy". The scale ranges from approximately -7 to -3.
* **Horizontal Axis 1 (x-axis):** "θ2". The scale ranges from -5 to 5.
* **Horizontal Axis 2 (z-axis):** "θ1". The scale ranges from -5 to 5.
* **Color Scale:** The surface is colored according to the Free Energy value. Purple/blue represents lower values, transitioning to green and yellow for higher values.
### Detailed Analysis
The surface plot shows a saddle point.
* Along the θ2 axis, the Free Energy initially decreases as θ2 moves away from 0, reaching a minimum around θ2 = ±4.
* Along the θ1 axis, the Free Energy increases as θ1 moves away from 0, reaching a maximum around θ1 = ±2.
* The lowest Free Energy values (approximately -7) are observed at the corners of the plot where θ1 is near 0 and θ2 is near ±5.
* The highest Free Energy values (approximately -3) are observed near the center of the plot where θ1 is near ±2 and θ2 is near 0.
### Key Observations
* The plot exhibits a clear saddle point, indicating a minimum energy configuration along one dimension and a maximum along another.
* The Free Energy is highly sensitive to changes in both θ1 and θ2.
* The global minimum Free Energy is located at the corners of the plot.
### Interpretation
The 3D surface plot visualizes the energy landscape of a system with two degrees of freedom, θ1 and θ2. The saddle point suggests that the system has a stable configuration (minimum energy) along one direction (θ2) and an unstable configuration (maximum energy) along another direction (θ1). This type of energy landscape is common in chemical reactions and other physical systems where multiple variables influence the overall energy. The plot provides insights into the stability and dynamics of the system, indicating the preferred configurations and the energy barriers that must be overcome to transition between different states.