# Technical Document Extraction: Astronomical Observations
## Image Description
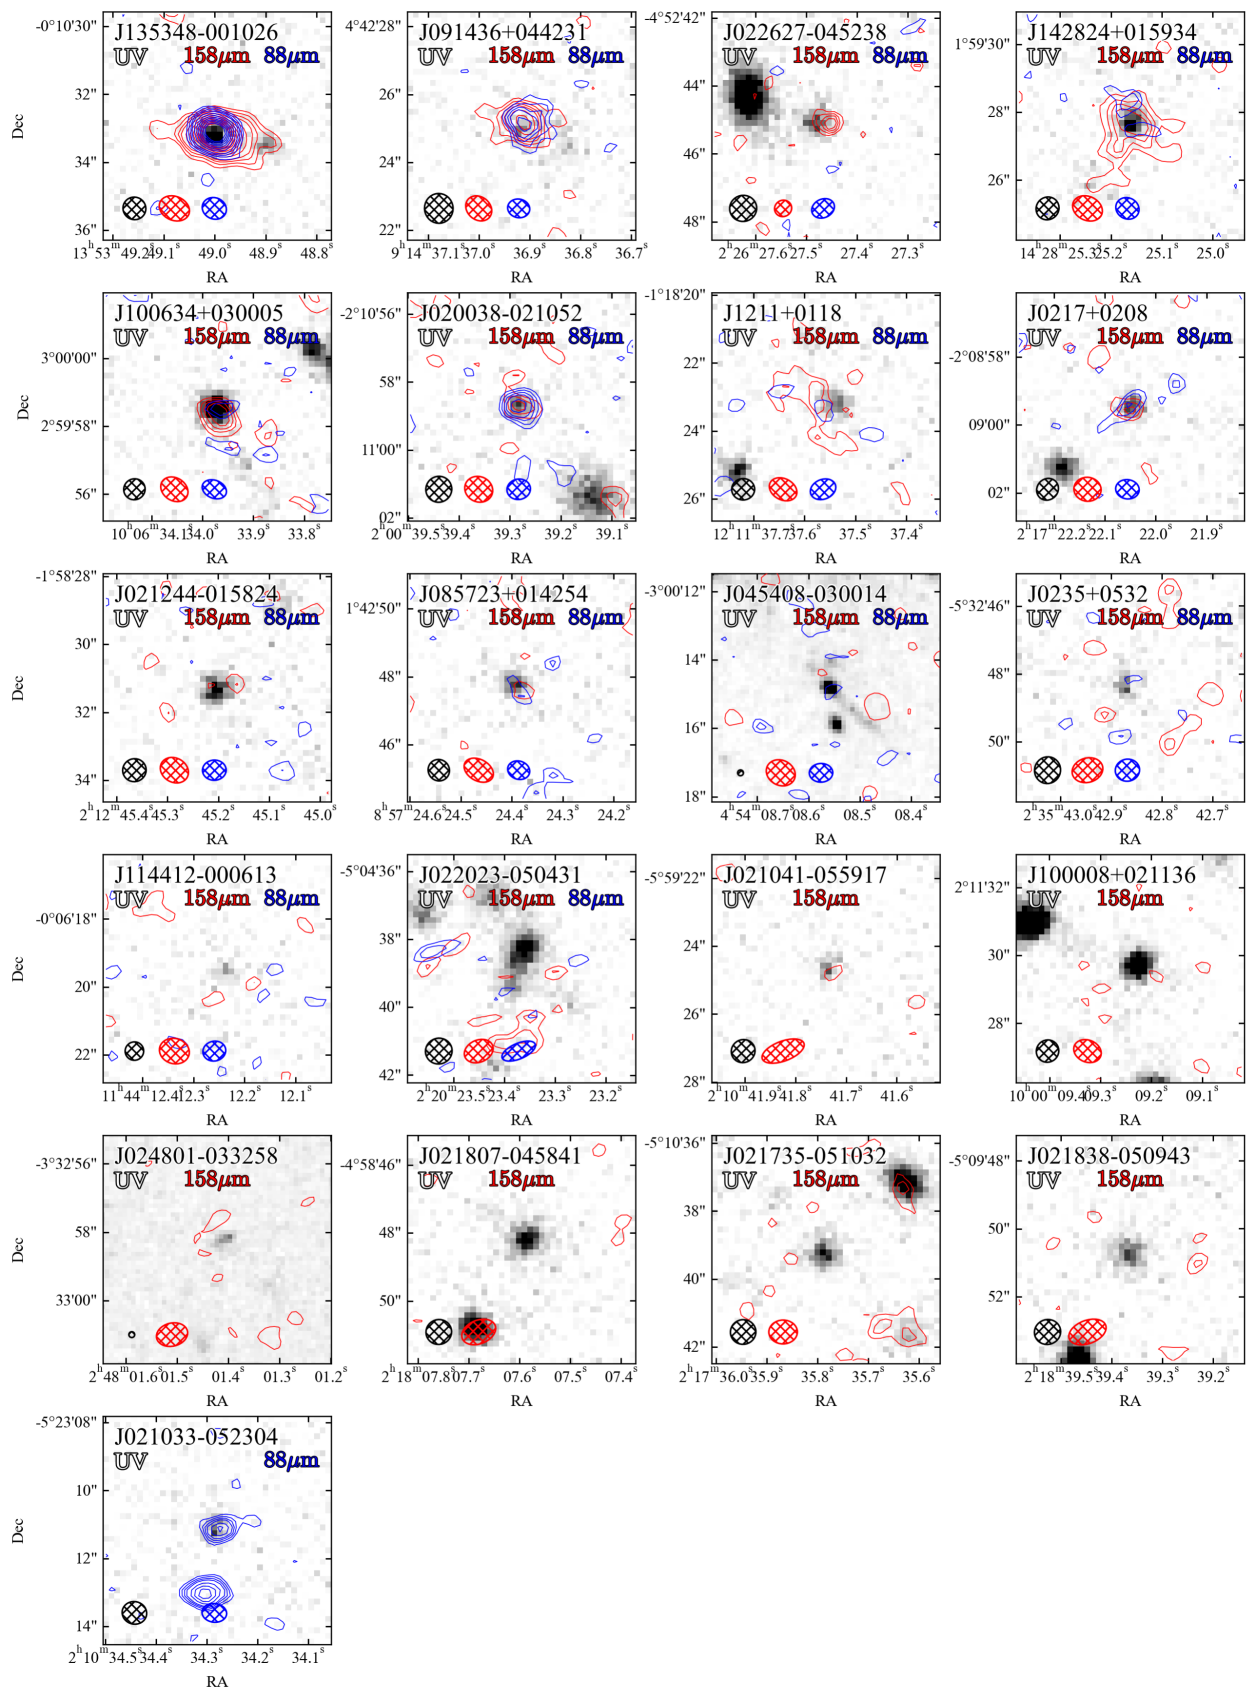
The image is a 4x4 grid of 16 panels, each depicting astronomical observations of different celestial objects. Each panel contains:
- **UV (Ultraviolet)** data (black contours)
- **158µm (Submillimeter)** data (red contours)
- **88µm (Far-Infrared)** data (blue contours)
- Coordinate axes labeled **RA (Right Ascension)** and **Dec (Declination)** in degrees
- Object identifiers in the format `J[number]+[number]` (e.g., `J135348-001026`)
## Key Components
### Axis Labels
- **X-axis**: RA (Right Ascension) in degrees (e.g., `13^h 53^m 49.2^s` to `48^d 59.1^s`)
- **Y-axis**: Dec (Declination) in degrees (e.g., `-0°10'30"` to `52°42'28"`)
### Panel Titles
Each panel is labeled with:
- Object identifier (e.g., `J135348-001026`)
- Wavelength labels: `UV`, `158µm`, `88µm`
### Contour Colors
- **Black**: UV (Ultraviolet) data
- **Red**: 158µm (Submillimeter) data
- **Blue**: 88µm (Far-Infrared) data
### Spatial Grounding
- **Legend**: Not explicitly visible in the image. Colors are inferred from standard astronomical conventions (black = UV, red = 158µm, blue = 88µm).
- **Data Points**: Contours are plotted at specific RA/Dec coordinates (e.g., `13^h 53^m 49.2^s`, `32° 34' 36"`).
## Trends and Observations
1. **Emission Features**:
- Most panels show concentrated emission in the center (e.g., `J135348-001026` has a bright red/blue core).
- Some panels exhibit extended structures (e.g., `J091436+044231` has diffuse red contours).
2. **Wavelength Correlation**:
- 158µm (red) and 88µm (blue) contours often align spatially, suggesting shared emission sources.
- UV (black) contours are less prominent, indicating weaker ultraviolet emission.
3. **Object Variability**:
- Objects like `J022627-045238` show asymmetric emission (e.g., red contours dominate the left side).
- `J021735-051032` has a compact red core with faint blue extensions.
## Notes
- No explicit legend is present in the image. Color assignments are based on standard astronomical conventions.
- All text is in English. No non-English content detected.
- No data tables or numerical values are explicitly provided beyond axis labels and object identifiers.
## Conclusion
The image provides a comparative analysis of multi-wavelength emissions (UV, 158µm, 88µm) for 16 celestial objects. Spatial correlations between wavelengths suggest shared physical processes, while variations in contour morphology highlight differences in object structure and emission mechanisms.