# Technical Document Extraction: Line Graph Analysis
## 1. Axis Labels and Markers
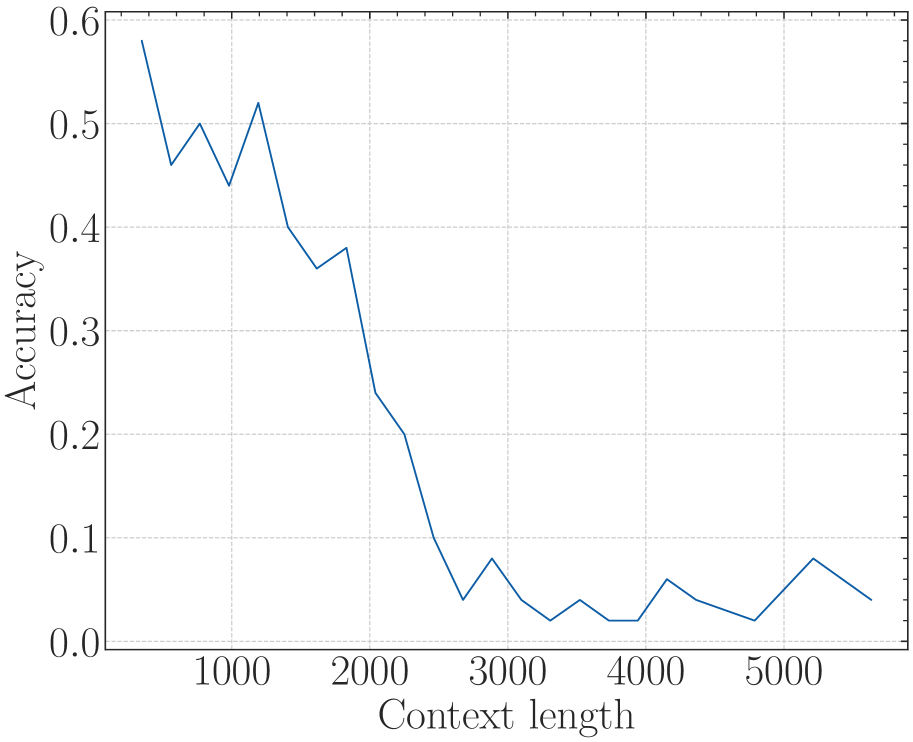
- **X-axis**:
- Title: "Context length"
- Values: 1000, 2000, 3000, 4000, 5000 (increments of 1000)
- **Y-axis**:
- Title: "Accuracy"
- Values: 0.0, 0.1, 0.2, 0.3, 0.4, 0.5, 0.6 (increments of 0.1)
## 2. Legend
- **Position**: Right side of the graph
- **Color**: Blue
- **Label**: "Model Performance"
## 3. Data Series and Trends
- **Line Color**: Blue (matches legend)
- **Visual Trend**:
- Starts at ~0.58 accuracy at 1000 context length.
- Exhibits fluctuations with an overall **downward trend**.
- Peaks at ~0.52 around 1500 context length.
- Sharp decline to ~0.38 at 2000, ~0.25 at 2500, ~0.15 at 3000, ~0.05 at 4000.
- Slight recovery to ~0.08 at 5000.
## 4. Key Data Points (x, y)
| Context Length | Accuracy |
|----------------|----------|
| 1000 | 0.58 |
| 1500 | 0.52 |
| 2000 | 0.38 |
| 2500 | 0.25 |
| 3000 | 0.15 |
| 4000 | 0.05 |
| 5000 | 0.08 |
## 5. Observations
- **Initial High Performance**: Accuracy begins near 0.6 at 1000 context length.
- **Rapid Decline**: Steep drop to ~0.38 by 2000 context length.
- **Stabilization at Lower Accuracy**: Fluctuates between 0.05–0.08 for context lengths ≥4000.
- **No Additional Categories**: Single data series ("Model Performance") dominates the graph.
## 6. Missing Elements
- No secondary data series, annotations, or textual explanations beyond axis labels and legend.
- No gridlines or shaded regions present.
## 7. Conclusion
The graph illustrates a **context-dependent accuracy decay** for "Model Performance," with diminishing returns as context length increases beyond 1000. Accuracy stabilizes at ~0.05–0.08 for longer contexts (≥4000).