## Scatter Plot: Execution Time vs. Number of Spins
### Overview
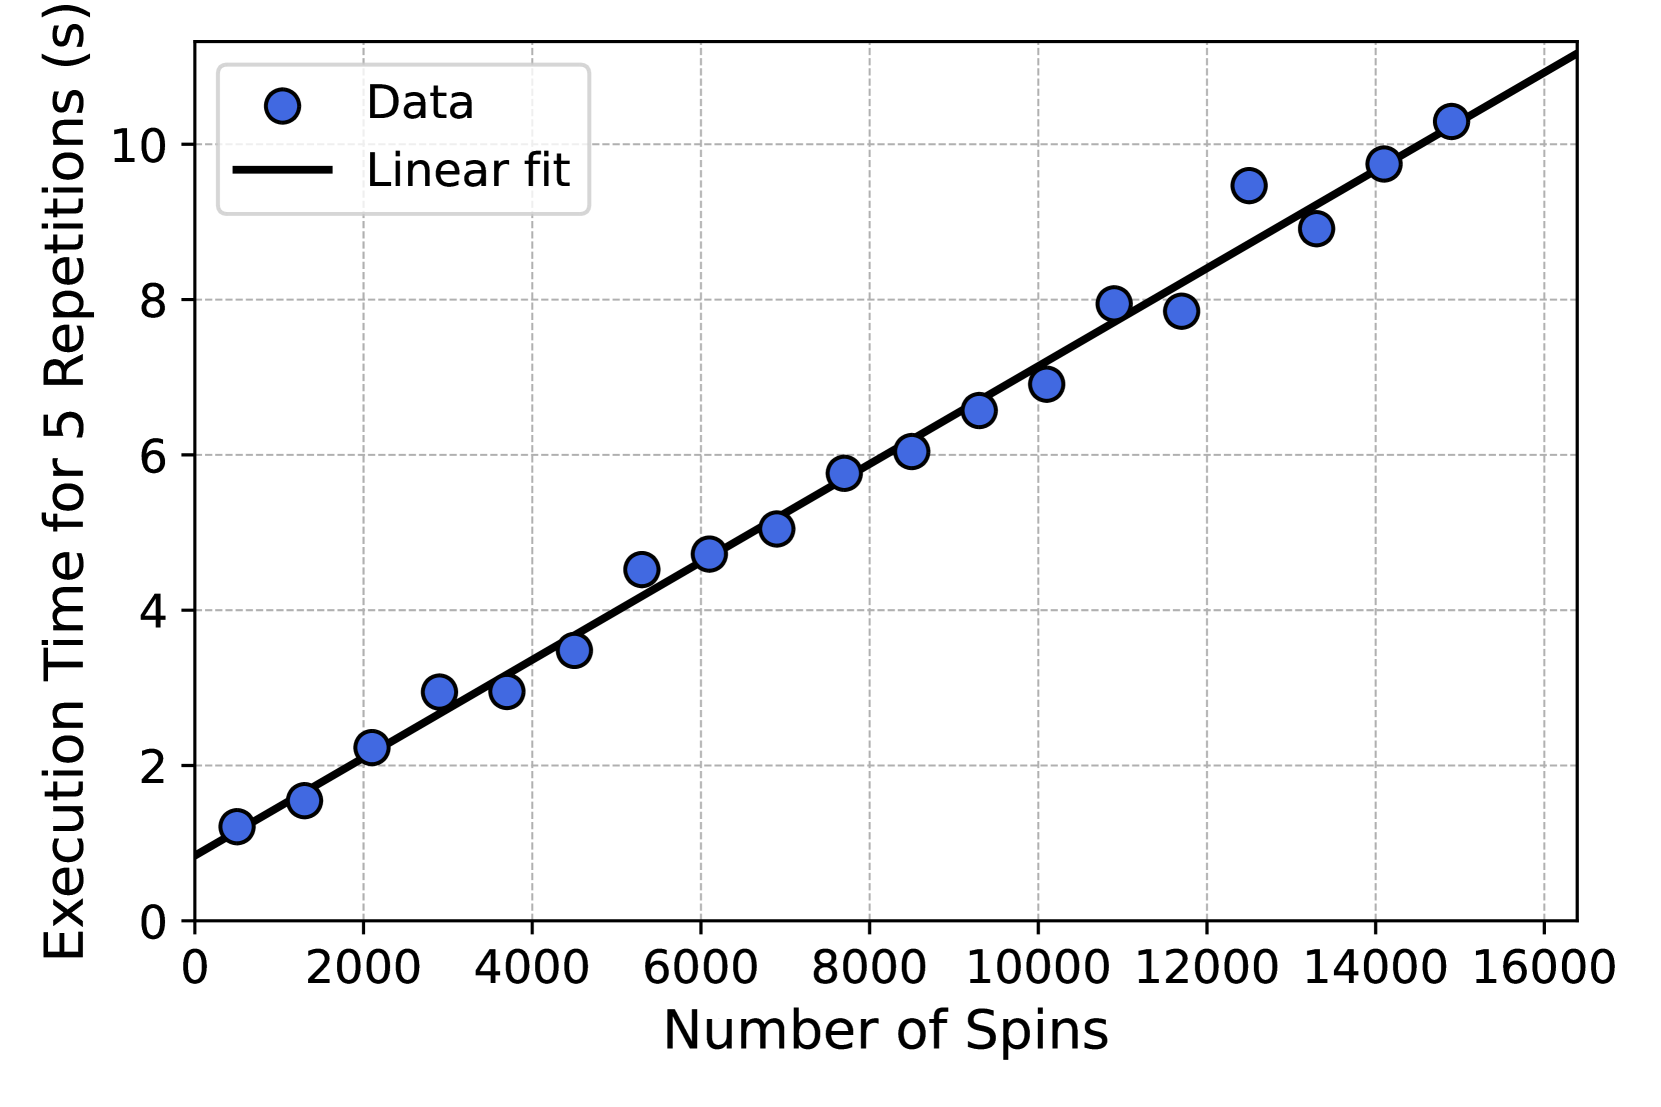
The image is a scatter plot showing the relationship between the number of spins and the execution time for 5 repetitions. The plot includes data points and a linear fit line. The data points generally follow a linear trend, with some deviation.
### Components/Axes
* **X-axis:** Number of Spins, ranging from 0 to 16000, with increments of 2000.
* **Y-axis:** Execution Time for 5 Repetitions (s), ranging from 0 to 10, with increments of 2.
* **Legend (Top-Left):**
* Blue circles: Data
* Black line: Linear fit
* **Gridlines:** Light gray dashed lines are present in the background.
### Detailed Analysis
* **Data Points (Blue Circles):** The data points show a generally linear relationship between the number of spins and the execution time.
* At 1000 spins, the execution time is approximately 1.3 seconds.
* At 3000 spins, the execution time is approximately 3 seconds.
* At 5000 spins, the execution time is approximately 4 seconds.
* At 7000 spins, the execution time is approximately 5 seconds.
* At 9000 spins, the execution time is approximately 6.5 seconds.
* At 11000 spins, the execution time is approximately 7 seconds.
* At 12000 spins, the execution time is approximately 8 seconds.
* At 13000 spins, the execution time is approximately 9.5 seconds.
* At 15000 spins, the execution time is approximately 10 seconds.
* **Linear Fit (Black Line):** The black line represents the linear fit of the data. It starts at approximately 0.8 seconds at 0 spins and increases linearly to approximately 11 seconds at 16000 spins.
### Key Observations
* The execution time generally increases linearly with the number of spins.
* There is some scatter around the linear fit, indicating that the relationship is not perfectly linear.
* The data point at 13000 spins appears to deviate slightly above the linear fit.
### Interpretation
The plot suggests a strong positive correlation between the number of spins and the execution time for 5 repetitions. The linear fit provides a good approximation of this relationship. The scatter around the line may be due to various factors, such as experimental error or non-linear effects not captured by the linear model. The outlier at 13000 spins could be due to a measurement error or a specific condition during that trial. Overall, the data indicates that increasing the number of spins leads to a predictable increase in execution time.