## Diagram: Dimensionality Reduction and Feature Selection Process
### Overview
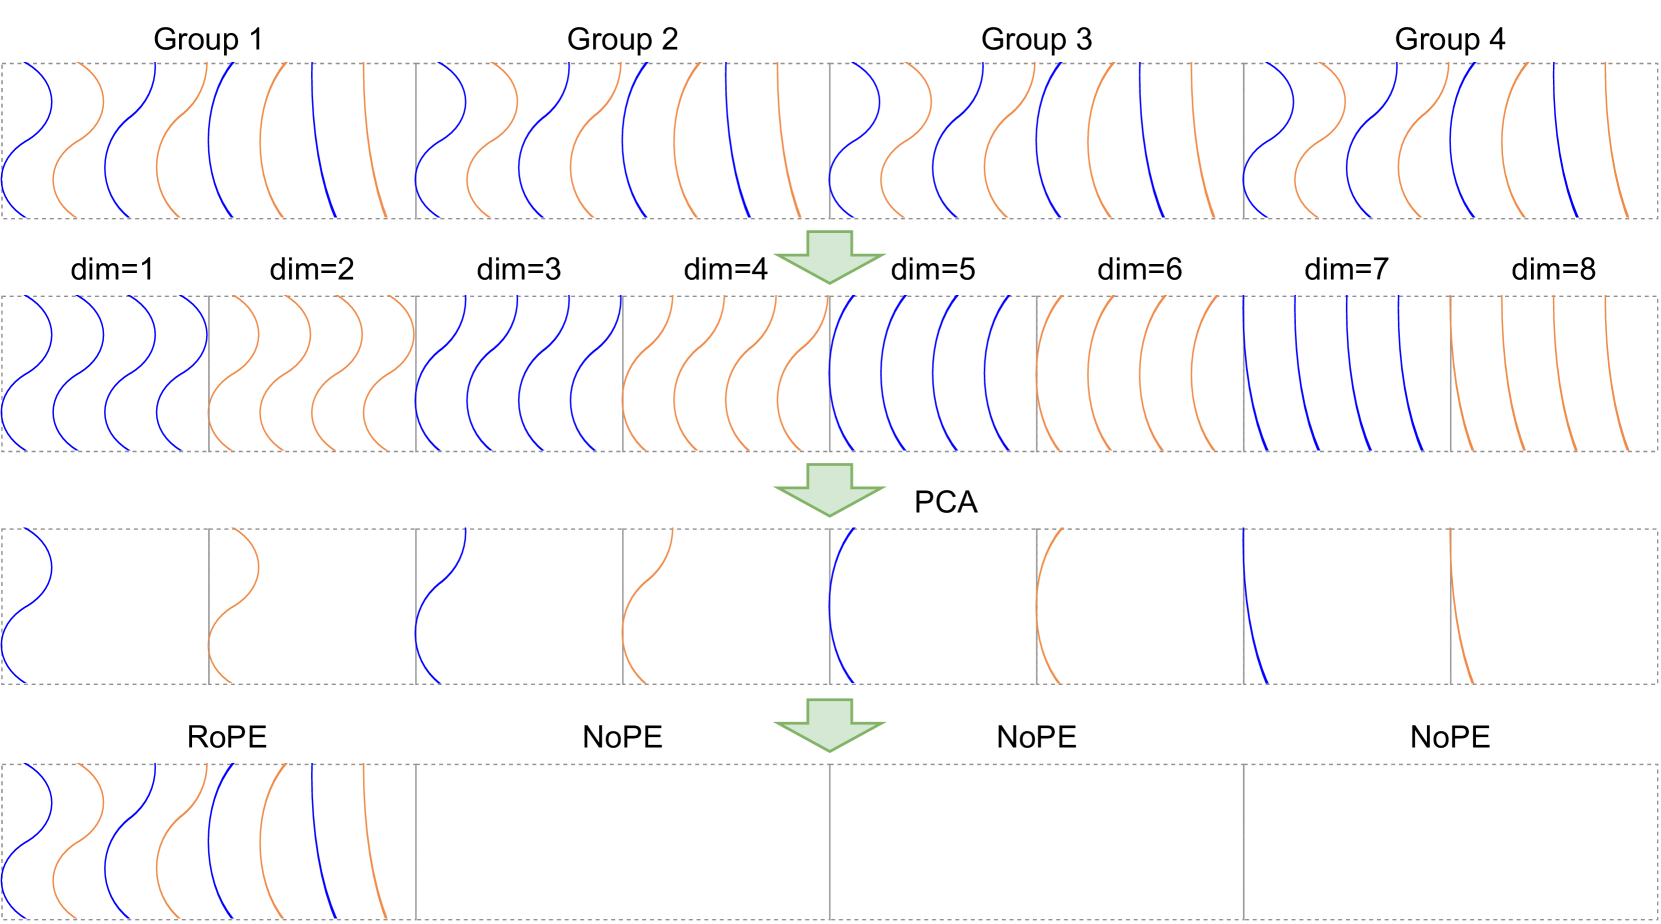
The diagram illustrates a multi-stage data processing pipeline involving dimensionality reduction and feature selection. It shows four groups of data (Group 1-4) with varying dimensionality (dim=1-8), followed by Principal Component Analysis (PCA) and a RoPE/NoPE classification system. The visualization uses blue and orange lines to represent different data groups, with spatial transitions indicating processing stages.
### Components/Axes
1. **Groups**:
- Group 1 (blue lines)
- Group 2 (orange lines)
- Group 3 (blue lines)
- Group 4 (orange lines)
2. **Dimensions**:
- dim=1 (most wavy lines)
- dim=2-8 (progressively straighter lines)
3. **Processing Stages**:
- Original data (top section)
- PCA (middle section)
- RoPE/NoPE classification (bottom section)
4. **Legend**:
- Blue = Group 1
- Orange = Group 2
- *Note: Groups 3 and 4 lack explicit legend entries despite being visually present*
### Detailed Analysis
1. **Original Data (Groups 1-4)**:
- dim=1: Highly wavy lines with significant curvature
- dim=2-4: Gradual reduction in wave amplitude
- dim=5-8: Nearly straight lines with minimal curvature
- *Spatial Pattern*: Groups alternate between blue (Group 1) and orange (Group 2) lines, with Groups 3 and 4 appearing as continuation of the pattern but without explicit grouping markers
2. **PCA Transition**:
- Reduced to 4 principal components (dim=1-4)
- Lines become more linear and parallel
- Loss of original group color differentiation (both blue and orange lines merge)
3. **RoPE/NoPE Classification**:
- RoPE (Retained Principal Components):
- dim=1-2: Maintains some curvature
- dim=3-4: Linear but distinct from NoPE
- NoPE (Non-Retained Principal Components):
- dim=5-8: Completely removed (empty space)
- *Spatial Pattern*: Clear separation between retained (RoPE) and discarded (NoPE) components
### Key Observations
1. **Legend Inconsistency**: Groups 3 and 4 are visually present but lack legend entries, suggesting either:
- Omission in legend design
- Intentional exclusion from primary analysis
- Potential data categorization error
2. **Dimensionality Impact**:
- Higher dimensions (dim=5-8) show near-linear patterns
- Suggests original data may have been artificially constructed with increasing linearity
3. **Feature Selection Effectiveness**:
- PCA reduces complexity but loses group differentiation
- RoPE preserves critical curvature in first 2 dimensions
- NoPE effectively removes higher-dimensional noise
### Interpretation
This diagram demonstrates a dimensionality reduction workflow where:
1. **Data Complexity Reduction**: PCA successfully simplifies the data structure but at the cost of losing original group distinctions
2. **Feature Importance**: The first two principal components (RoPE) retain meaningful curvature patterns, while higher dimensions (NoPE) appear to contain less discriminative information
3. **Group Representation**: The absence of Groups 3 and 4 in the legend raises questions about their role in the analysis - they may represent:
- Secondary data categories
- Noise components
- Unlabeled outliers
The workflow suggests a two-stage analysis where initial dimensionality reduction (PCA) is followed by feature selection (RoPE/NoPE) to identify the most informative components. The visual progression from wavy to linear patterns across dimensions indicates an artificial construction where higher dimensions lose their original discriminative power.