\n
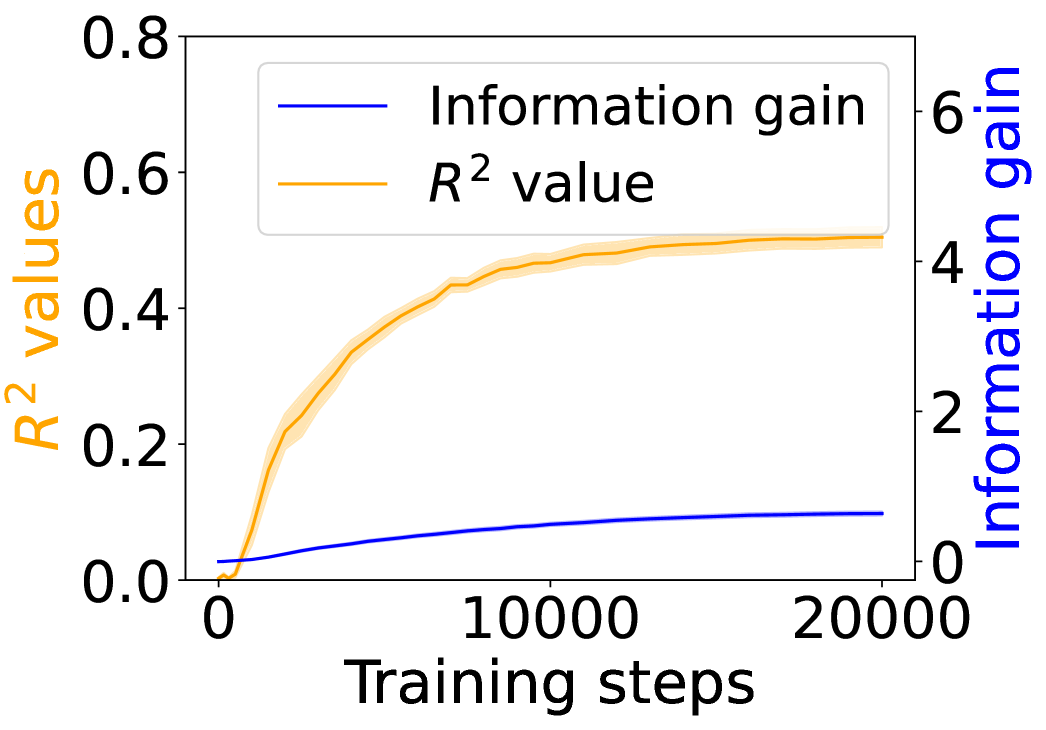
## Line Chart: Training Performance Metrics
### Overview
This image presents a line chart illustrating the relationship between training steps and two performance metrics: Information Gain and R² value. The chart tracks these metrics during a training process, likely for a machine learning model. The x-axis represents the number of training steps, while the left y-axis represents the R² value and the right y-axis represents the Information Gain.
### Components/Axes
* **X-axis:** "Training steps" ranging from 0 to approximately 20000.
* **Left Y-axis:** "R² values" ranging from 0 to 0.8.
* **Right Y-axis:** "Information gain" ranging from 0 to 6.
* **Legend:** Located in the top-left corner, containing two entries:
* "Information gain" - represented by a blue line.
* "R² value" - represented by an orange line.
### Detailed Analysis
* **R² Value (Orange Line):** The orange line representing the R² value starts at approximately 0.02 at 0 training steps. It exhibits a steep upward trend initially, reaching approximately 0.2 at around 2000 training steps. The slope gradually decreases, and the line continues to rise, reaching approximately 0.52 at 20000 training steps.
* **Information Gain (Blue Line):** The blue line representing Information Gain starts at approximately 0 at 0 training steps. It shows a slow, relatively linear increase throughout the training process. At 20000 training steps, the Information Gain reaches approximately 1.2.
### Key Observations
* The R² value increases rapidly during the initial training phase, indicating a significant improvement in model fit. The rate of improvement slows down as training progresses.
* Information Gain increases steadily but at a slower rate than the R² value.
* The R² value is significantly higher than the Information Gain across all training steps.
* Both metrics appear to converge towards a plateau as the number of training steps increases, suggesting diminishing returns from further training.
### Interpretation
The chart suggests that the model is learning and improving its fit to the training data, as evidenced by the increasing R² value. The initial rapid increase in R² indicates that the model quickly captures the most important patterns in the data. The slower increase later in training suggests that the model is refining its fit and capturing more subtle patterns. The steady increase in Information Gain indicates that the model is consistently gaining more information from the training data.
The difference in scale between the two metrics suggests that R² is a more sensitive measure of model performance in this context. The convergence of both metrics towards a plateau indicates that the model may be approaching its maximum performance level, and further training may not yield significant improvements. It is important to note that this analysis is based solely on the provided chart and does not consider other factors that may influence model performance, such as overfitting or generalization error.