\n
## Diagram: Information Retrieval Flow for "Where do the Appalachian Mountains run?"
### Overview
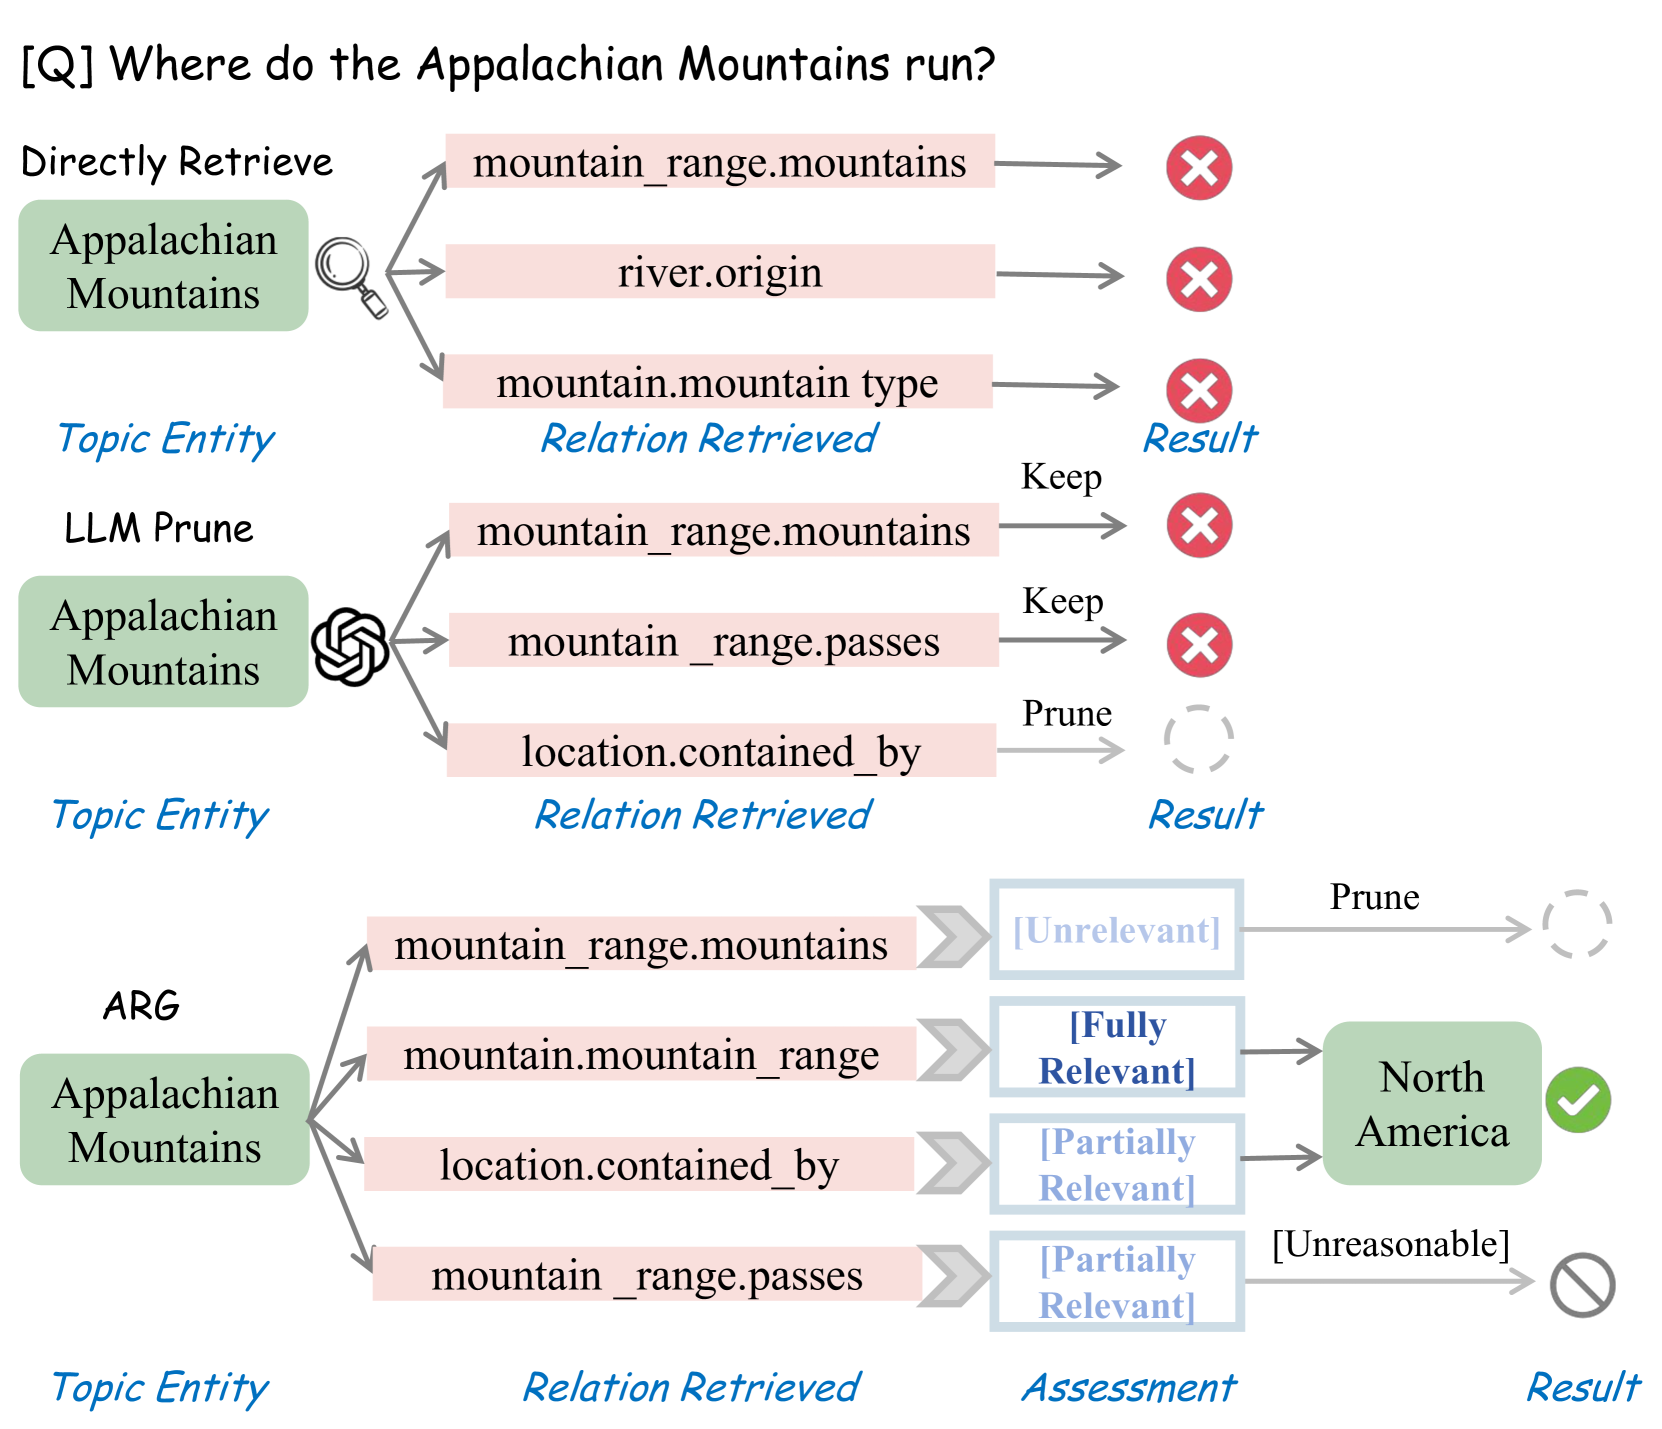
This diagram illustrates a multi-stage information retrieval process designed to answer the question "Where do the Appalachian Mountains run?". It depicts three distinct approaches: Directly Retrieve, LLM Prune, and ARG (likely Augmented Retrieval Generation), showing how each handles relation retrieval and assessment of results. The diagram uses arrows to indicate flow, and color-coded symbols to represent the outcome of each step.
### Components/Axes
The diagram is structured into three vertical columns, each representing a different retrieval method. Each column is further divided into stages:
1. **Topic Entity:** Displays the initial query focus ("Appalachian Mountains").
2. **Relation Retrieved:** Shows the relationships extracted from a knowledge base.
3. **Assessment:** Indicates the relevance of the retrieved relation.
4. **Result:** Displays the final outcome (either a successful answer or a rejection).
The diagram also includes a top-level question: "[Q] Where do the Appalachian Mountains run?".
The color scheme is as follows:
* **Gray:** Represents a rejected or pruned result.
* **Green:** Represents a successful or relevant result.
* **Yellow:** Represents a partially relevant result.
* **Blue:** Indicates the relation retrieved.
### Detailed Analysis or Content Details
**1. Directly Retrieve:**
* **Topic Entity:** "Appalachian Mountains"
* **Relation Retrieved:**
* "mountain\_range.mountains" – Result: Rejected (Red 'X')
* "river.origin" – Result: Rejected (Red 'X')
* This method fails to produce a relevant result.
**2. LLM Prune:**
* **Topic Entity:** "Appalachian Mountains"
* **Relation Retrieved:**
* "mountain\_range.mountains" – Assessment: "Keep" – Result: Rejected (Red 'X')
* "mountain\_range.passes" – Assessment: "Keep" – Result: Rejected (Red 'X')
* "location.contained\_by" – Assessment: "Prune" – Result: Pruned (Gray swirl)
* Despite the LLM keeping some relations, the final results are pruned or rejected.
**3. ARG:**
* **Topic Entity:** "Appalachian Mountains"
* **Relation Retrieved:**
* "mountain\_range.mountains" – Assessment: "[Irrelevant]" – Result: Pruned (Gray swirl)
* "mountain.mountain\_range" – Assessment: "[Fully Relevant]" – Result: "North America" (Green checkmark)
* "location.contained\_by" – Assessment: "[Partially Relevant]" – Result: Pruned (Gray swirl)
* "mountain\_range.passes" – Assessment: "[Partially Relevant]" – Result: Unreasonable (Gray swirl with line)
* This method successfully identifies "North America" as the answer, based on the "mountain.mountain\_range" relation.
### Key Observations
* The "Directly Retrieve" method consistently fails to find a relevant answer.
* The "LLM Prune" method keeps some relations but ultimately discards them.
* The "ARG" method is the only one that successfully answers the question, leveraging the "mountain.mountain\_range" relation.
* The assessment stage plays a crucial role in filtering irrelevant or unreasonable results.
* The diagram highlights the importance of relation retrieval and assessment in answering complex questions.
### Interpretation
The diagram demonstrates a comparative analysis of different information retrieval strategies. It suggests that a more sophisticated approach, like the ARG method, is necessary to accurately answer questions requiring relational reasoning. The "Directly Retrieve" method is too simplistic, while the "LLM Prune" method, although incorporating some intelligence, is not sufficient on its own. The ARG method's success indicates that combining relation retrieval with a robust assessment process is key to achieving accurate results. The use of "Fully Relevant," "Partially Relevant," and "Irrelevant" assessments suggests a nuanced understanding of the relationships between entities, allowing the system to prioritize the most informative connections. The diagram illustrates a pipeline where initial retrieval is followed by filtering and refinement, ultimately leading to a confident answer. The "Unreasonable" result suggests a mechanism for identifying and discarding nonsensical or illogical connections. This diagram is a visual representation of a knowledge graph traversal and reasoning process.