\n
## Diagram: Tree Representation of a Theorem
### Overview
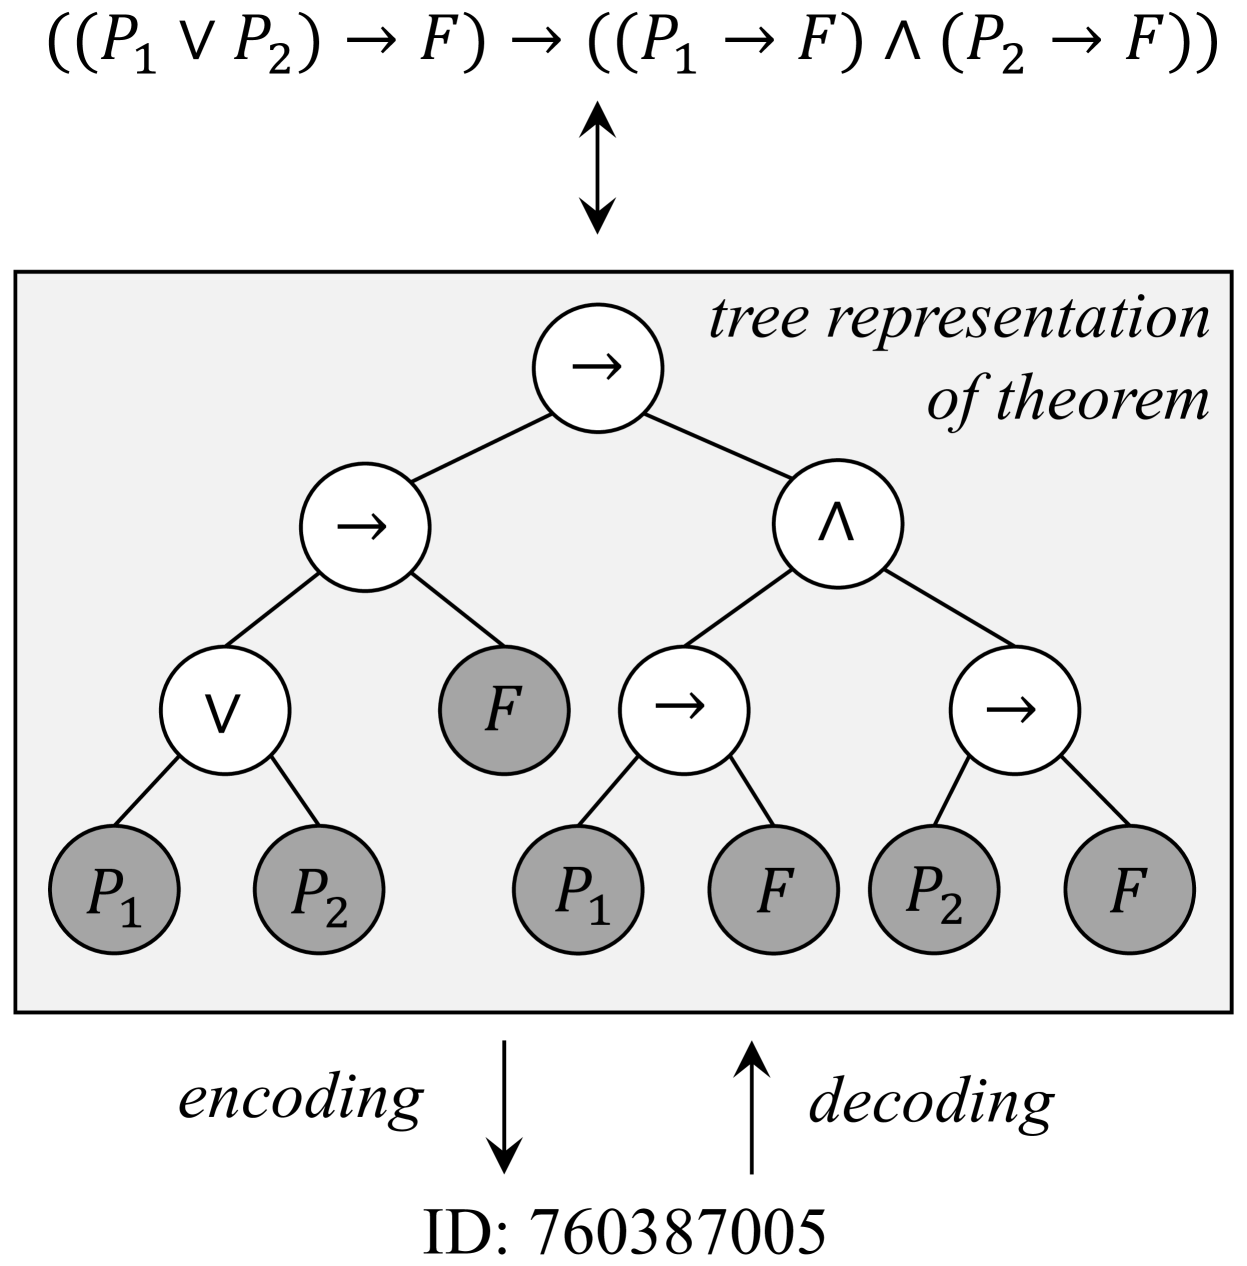
The image depicts a tree diagram representing a logical theorem. The diagram illustrates the decomposition of a complex logical statement into its constituent parts, showing the encoding and decoding process. The theorem itself is presented above the diagram, and an ID number is provided below.
### Components/Axes
The diagram consists of interconnected nodes representing logical operators and propositions. The nodes are:
* **Logical Operators:** "→" (implication), "∨" (disjunction), "∧" (conjunction), "F" (False), "P₁", "P₂" (propositions).
* **Theorem:** ((P₁ ∨ P₂) → F) → ((P₁ → F) ∧ (P₂ → F))
* **Arrows:** Bidirectional arrow indicating the relationship between the theorem and its tree representation. Arrows labeled "encoding" and "decoding" indicate the direction of transformation.
* **ID:** 760387005
### Detailed Analysis or Content Details
The tree diagram is structured as follows, starting from the bottom and moving upwards:
1. **Bottom Layer:** Contains the propositions P₁, P₂, F, P₁, F, P₂, F. These are represented as filled circles.
2. **Second Layer:** Contains the implication operator "→" connecting P₁ to F, and P₂ to F. Also contains the disjunction operator "∨" connecting P₁ and P₂.
3. **Third Layer:** Contains the implication operator "→" connecting (P₁ ∨ P₂) to F, and the conjunction operator "∧" connecting (P₁ → F) and (P₂ → F).
4. **Top Layer:** Contains the implication operator "→" connecting ((P₁ ∨ P₂) → F) to ((P₁ → F) ∧ (P₂ → F)).
The diagram shows a clear flow from the propositions at the bottom to the complex theorem at the top. The "encoding" arrow points downwards, suggesting the transformation of the theorem into its tree representation. The "decoding" arrow points upwards, indicating the reverse process.
### Key Observations
The diagram visually represents the logical equivalence between the theorem and its tree representation. The tree structure breaks down the complex theorem into simpler components, making it easier to understand and analyze. The symmetry in the structure suggests a balanced logical relationship.
### Interpretation
The diagram demonstrates the process of logical decomposition and reconstruction. The encoding process transforms a complex logical statement into a tree structure, which can be used for analysis and simplification. The decoding process reverses this transformation, reconstructing the original statement from its tree representation. This is a common technique in logic and computer science for representing and manipulating logical expressions. The ID number suggests this diagram might be part of a larger dataset or a specific logical system. The diagram illustrates a fundamental principle of logic: complex statements can be built from simpler ones, and vice versa. The use of a tree structure provides a clear and intuitive way to visualize this relationship.