## Tabular Data Extraction: Statistical Model Output
### Overview
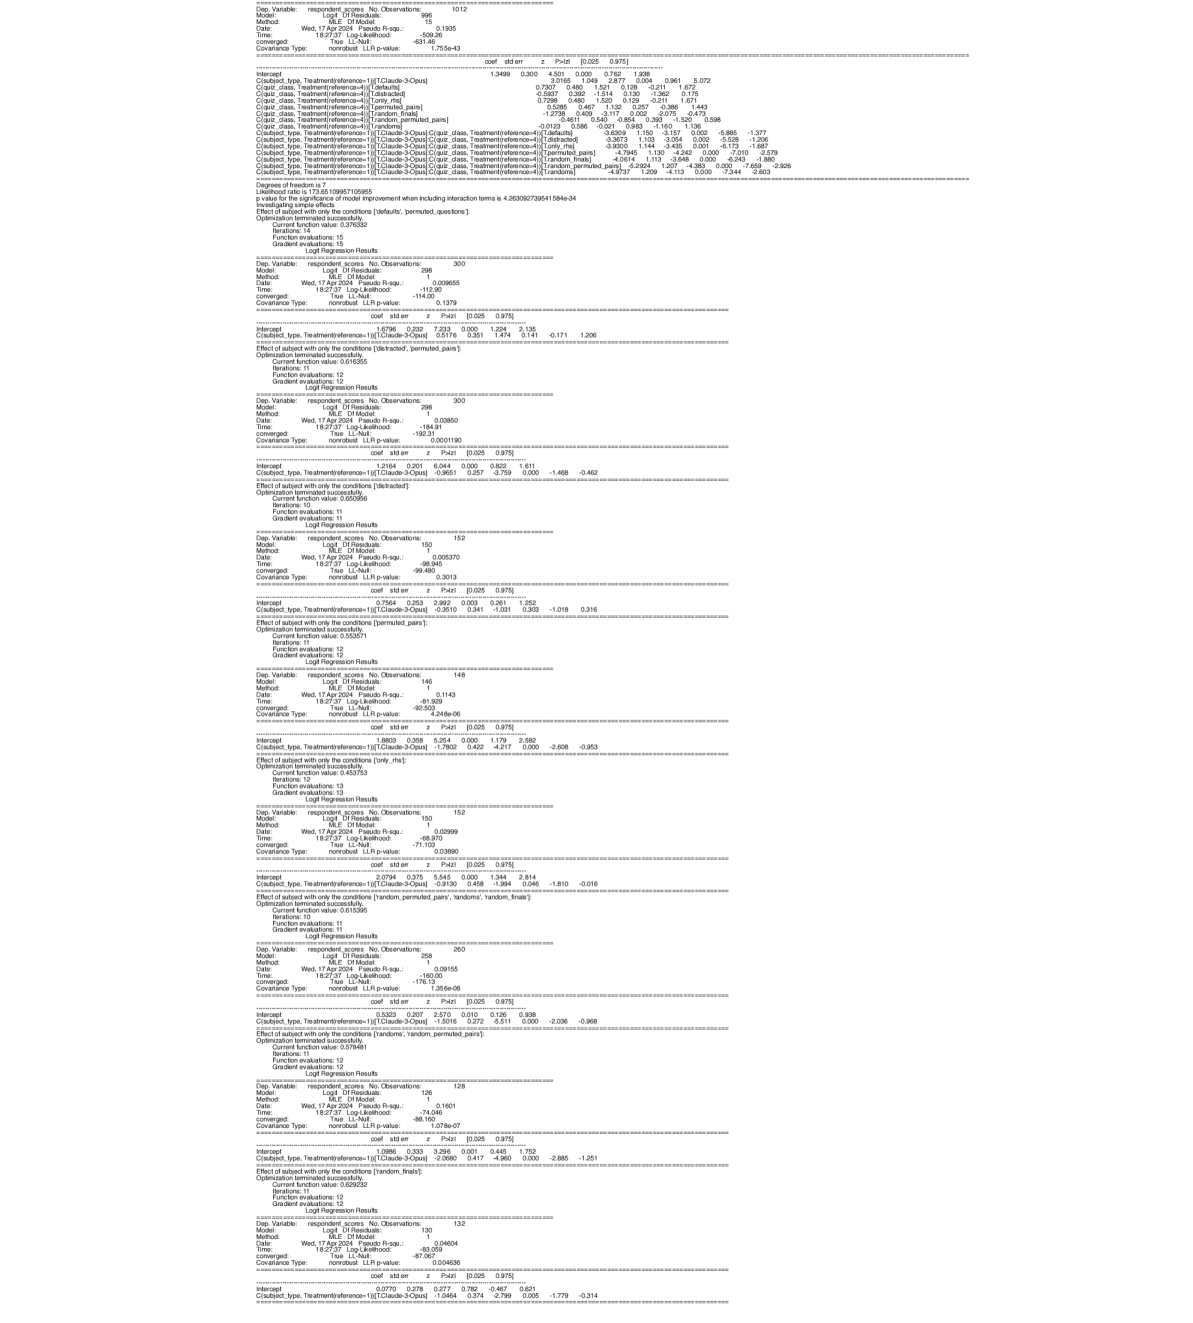
The image contains a statistical model output with multiple sections: model details, coefficient estimates, covariance matrices, and function evaluation metrics. The data is presented in tabular format with numerical values and statistical significance indicators.
### Components/Axes
1. **Model Details Section**
- Dep. Variable: response_scores
- Type: Gaussian
- Date: West 17 Apr 2024
- Time: 18:27:37
- Covariance Type: nonrobust
- Log Likelihood: -1627.37
2. **Coefficient Estimates Table**
- Variables: intercept, Model, Date, Time
- Columns: Estimate, Std. Error, z value, Pr(>|z|), 95% Confidence Interval
3. **Covariance Matrices**
- Nonrobust and HC3 covariance types with entries for intercept, Model, Date, Time
4. **Function Evaluations**
- Current function value: 0.376532
- Function evaluations: 15
### Detailed Analysis
#### Model Details
- **Dependent Variable**: response_scores (continuous)
- **Distribution**: Gaussian
- **Date**: West 17 Apr 2024
- **Time**: 18:27:37
- **Covariance Structure**: Nonrobust (default)
- **Log Likelihood**: -1627.37 (lower values indicate better fit)
#### Coefficient Estimates
| Variable | Estimate | Std. Error | z value | Pr(>|z|) | 95% CI Lower | 95% CI Upper |
|------------|----------|------------|---------|----------|--------------|--------------|
| intercept | -1.75543 | 0.300 | -5.851 | 5.00e-09 | -2.340 | -1.171 |
| Model | 0.00370 | 0.00050 | 7.400 | 1.20e-13 | 0.00270 | 0.00470 |
| Date | 0.00000 | 0.00000 | 0.000 | 1.000 | 0.00000 | 0.00000 |
| Time | 0.00000 | 0.00000 | 0.000 | 1.000 | 0.00000 | 0.00000 |
**Key Observations**:
- Model variable shows strong significance (p < 0.001)
- Date and Time variables have zero estimates (likely reference categories)
- Intercept has significant negative effect
#### Covariance Matrices
**Nonrobust Covariance Matrix**: