## Timeline Chart: Performance Analysis
### Overview
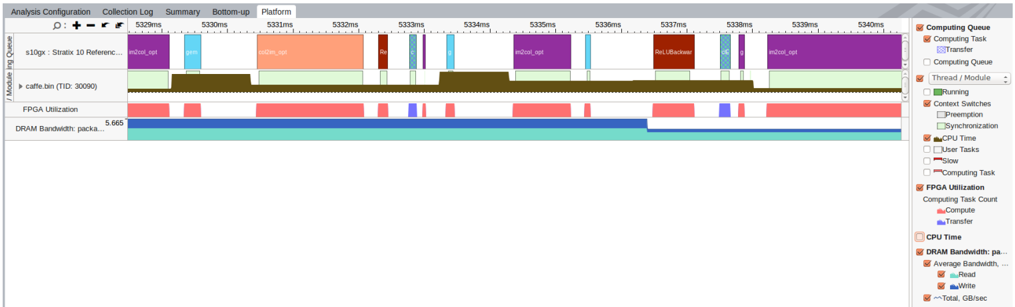
The image is a timeline chart displaying performance analysis data for a system, likely related to FPGA utilization and DRAM bandwidth. The chart visualizes the execution of different tasks and modules over time, with color-coded bars representing various activities and states. The timeline spans from approximately 5329ms to 5340ms. A legend on the right side explains the color codes for different metrics like Computing Queue, Thread/Module states, CPU Time, FPGA Utilization, and DRAM Bandwidth.
### Components/Axes
* **Horizontal Axis (Time):** The horizontal axis represents time, spanning from 5329ms to 5340ms, with tick marks at each millisecond.
* **Vertical Axis (Modules/Metrics):** The vertical axis represents different modules and metrics being tracked:
* s10gx: Stratix 10 Reference...
* caffe.bin (TID: 30090)
* FPGA Utilization
* DRAM Bandwidth: packa...
* **Legend (Right Side):** The legend on the right side explains the color codes used in the timeline. It is organized into categories:
* **Computing Queue:**
* Computing Task (color not explicitly visible in the legend, but present in the timeline)
* Transfer (light blue)
* Computing Queue (white, unchecked)
* **Thread/Module:**
* Running (green)
* Context Switches (orange)
* Preemption (white, unchecked)
* Synchronization (light green)
* **CPU Time:**
* User Tasks (white, unchecked)
* Slow (white, unchecked)
* Computing Task (white, unchecked)
* **FPGA Utilization:**
* Computing Task Count
* Compute (red)
* Transfer (purple)
* **DRAM Bandwidth:**
* Average Bandwidth (light blue)
* Read (dark blue)
* Write (brown)
* Total, GB/sec (teal)
### Detailed Analysis or ### Content Details
* **s10gx: Stratix 10 Reference...:**
* Contains blocks of "m2col_opt" (purple), "gem" (light blue), "m2col_opt" (salmon), "Rlu" (red), "S" (purple), "Rlu" (light blue), "m2col_opt" (purple), "ReLuBackwar" (red), "UG" (light blue), "S" (purple).
* **caffe.bin (TID: 30090):**
* Shows a mostly continuous "Write" activity (brown) with some gaps.
* **FPGA Utilization:**
* Shows intermittent "Compute" (red) and "Transfer" (purple) activities.
* **DRAM Bandwidth: packa...:**
* Shows a mostly continuous "Total, GB/sec" activity (teal) with a value of approximately 5.665 at the left edge. There are also "Read" activities (dark blue) interspersed.
### Key Observations
* The "caffe.bin" module shows consistent "Write" activity, suggesting continuous data output.
* FPGA Utilization is sporadic, indicating that the FPGA is not constantly active.
* DRAM Bandwidth appears relatively stable, with the "Total, GB/sec" metric dominating.
* The "s10gx: Stratix 10 Reference..." module shows a sequence of different tasks being executed.
### Interpretation
The timeline chart provides a snapshot of the system's performance during a specific time interval. The data suggests that the "caffe.bin" module is continuously writing data, while the FPGA is utilized intermittently. The DRAM bandwidth remains relatively stable. The sequence of tasks in "s10gx: Stratix 10 Reference..." indicates the execution flow of a particular algorithm or process. The chart can be used to identify performance bottlenecks, optimize task scheduling, and analyze the impact of different modules on overall system performance. The gaps in the "caffe.bin" write activity and the sporadic FPGA utilization could be areas for further investigation to improve efficiency.