TECHNICAL ASSET FINGERPRINT
ef10739931c4f336e08ce485
Click to view fullscreen
Press ESC or click to close
FOUND IN PAPERS
EXPERT: healer-alpha-free VERSION 1
RUNTIME: free/openrouter/healer-alpha
INTEL_VERIFIED
## Performance Analysis Timeline Chart: FPGA System Trace
### Overview
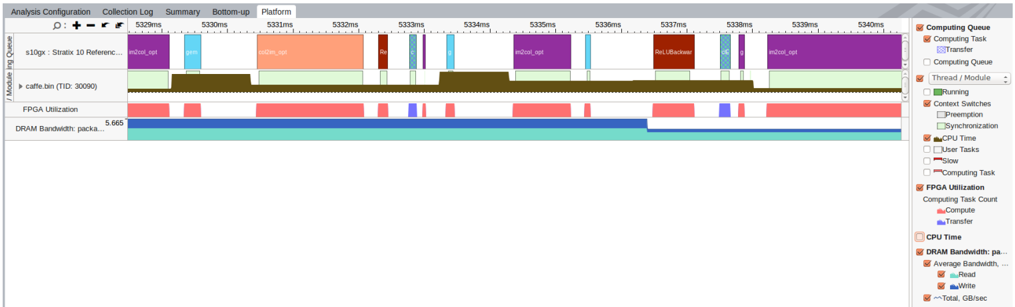
This image is a screenshot of a performance analysis tool displaying a timeline trace of an FPGA-based system executing a workload (likely a machine learning inference task, given the "caffe.bin" process name). The chart visualizes multiple concurrent metrics over a time span of approximately 11 milliseconds (from ~5329ms to ~5340ms). It is segmented into horizontal rows, each representing a different system resource or queue, with colored blocks indicating specific task types or states.
### Components/Axes
**Header Tabs (Top Bar):**
- Analysis Configuration
- Collection Log
- Summary
- Bottom-up
- Platform (currently selected)
**Main Chart Area:**
- **X-Axis (Time):** Linear timeline marked in milliseconds (ms). Visible markers: 5329ms, 5330ms, 5331ms, 5332ms, 5333ms, 5334ms, 5335ms, 5336ms, 5337ms, 5338ms, 5339ms, 5340ms.
- **Y-Axis (Rows/Metrics):** Five distinct horizontal rows, from top to bottom:
1. **Master 16 Queue:** Shows task scheduling for a specific hardware queue.
2. **s10gx - Stratix 10 Reference...** (truncated label): Likely the name of the FPGA platform or design.
3. **caffe.bin (TID: 30090):** A process thread (Thread ID 30090) of the Caffe deep learning framework.
4. **FPGA Utilization:** Shows the utilization state of the FPGA fabric.
5. **DRAM Bandwidth: packa... 5.665** (truncated label): Shows memory bandwidth, with a displayed average value of approximately 5.665 (unit inferred as GB/sec from legend).
**Legend (Right Panel):**
The legend is positioned on the right side of the chart and defines the color and pattern coding for all rows. It is organized into collapsible sections:
- **Computing Queue:**
- `Computing Task` (Solid Purple)
- `Transfer` (Solid Light Blue)
- `Computing Queue` (Outline/Empty Box)
- **Thread / Module:**
- `Thread / Module` (Solid Brown/Olive)
- `Context Switches` (Solid Red)
- `Preemption` (Solid Dark Blue)
- `Synchronization` (Solid Light Green)
- `Idle` (Solid Light Gray)
- `User Tasks` (Outline/Empty Box)
- `Sleep` (Outline/Empty Box)
- `Computing Task` (Outline/Empty Box)
- **FPGA Utilization:**
- `Computing Task Count` (Solid Red)
- `Transfer` (Solid Blue)
- **CPU Time:** (No specific color shown in visible legend area)
- **DRAM Bandwidth: pa...**
- `Average Bandwidth, ...` (Solid Teal/Cyan)
- `Read` (Solid Dark Blue)
- `Write` (Solid Red)
- `---Total, GB/sec` (Dashed Line, likely overlaid on the teal bar)
### Detailed Analysis
**Row 1: Master 16 Queue**
- **Trend:** Shows a sequence of discrete task blocks.
- **Data Points (Approximate Timing & Type):**
- ~5329.2ms to ~5329.8ms: Purple block (`Computing Task`).
- ~5329.8ms to ~5330.2ms: Light Blue block (`Transfer`).
- ~5330.2ms to ~5331.8ms: Large Purple block (`Computing Task`).
- ~5331.8ms to ~5332.2ms: Light Blue block (`Transfer`).
- ~5332.2ms to ~5332.5ms: Small Purple block (`Computing Task`).
- ~5332.5ms to ~5332.8ms: Light Blue block (`Transfer`).
- ~5332.8ms to ~5333.2ms: Small Purple block (`Computing Task`).
- ~5333.2ms to ~5333.5ms: Light Blue block (`Transfer`).
- ~5333.5ms to ~5334.2ms: Purple block (`Computing Task`).
- ~5334.2ms to ~5334.5ms: Light Blue block (`Transfer`).
- ~5334.5ms to ~5335.2ms: Purple block (`Computing Task`).
- ~5335.2ms to ~5335.5ms: Light Blue block (`Transfer`).
- ~5335.5ms to ~5336.8ms: Purple block (`Computing Task`).
- ~5336.8ms to ~5337.2ms: Dark Red/Brown block (Color not explicitly in legend, but may correspond to a different task type or a `Context Switch`).
- ~5337.2ms to ~5337.5ms: Light Blue block (`Transfer`).
- ~5337.5ms to ~5338.2ms: Purple block (`Computing Task`).
- ~5338.2ms to ~5338.5ms: Light Blue block (`Transfer`).
- ~5338.5ms to ~5339.8ms: Large Purple block (`Computing Task`).
**Row 2: s10gx - Stratix 10 Reference...**
- **Trend:** Shows a long, continuous block of activity.
- **Data Points:** A solid Brown/Olive block (`Thread / Module`) spans almost the entire visible timeline from ~5329ms to ~5340ms, indicating this hardware module is active throughout the captured window.
**Row 3: caffe.bin (TID: 30090)**
- **Trend:** Shows intermittent activity correlated with the Master Queue tasks.
- **Data Points:**
- A Brown/Olive block (`Thread / Module`) is present from ~5329ms to ~5330.5ms.
- Another Brown/Olive block from ~5331.5ms to ~5333ms.
- A third Brown/Olive block from ~5334ms to ~5335.5ms.
- A fourth Brown/Olive block from ~5336.5ms to ~5338ms.
- A fifth Brown/Olive block from ~5339ms to ~5340ms.
- The gaps between these blocks likely represent times when the thread is idle or preempted.
**Row 4: FPGA Utilization**
- **Trend:** Shows utilization states that align with the task types in the Master Queue.
- **Data Points:**
- Red blocks (`Computing Task Count`) appear during the Purple `Computing Task` periods in Row 1 (e.g., ~5330.2-5331.8ms, ~5333.5-5334.2ms).
- Blue blocks (`Transfer`) appear during the Light Blue `Transfer` periods in Row 1 (e.g., ~5329.8-5330.2ms, ~5331.8-5332.2ms).
- There are also brief Dark Blue blocks (possibly `Preemption` or a different state) around ~5332.8ms and ~5337.5ms.
**Row 5: DRAM Bandwidth: packa... 5.665**
- **Trend:** Shows a continuous, high-bandwidth utilization with minor fluctuations.
- **Data Points:** A solid Teal/Cyan bar (`Average Bandwidth`) spans the entire timeline. The value "5.665" is displayed on the left, which, according to the legend's "---Total, GB/sec" label, indicates an average total DRAM bandwidth of approximately **5.665 GB/sec** during this window. The bar's consistent color suggests the bandwidth is dominated by a single type (likely Read or Write, but the specific breakdown isn't visually distinguishable in this view).
### Key Observations
1. **Tight Correlation:** There is a clear, direct correlation between the task types in the "Master 16 Queue" (Row 1) and the "FPGA Utilization" states (Row 4). Every `Computing Task` (Purple) corresponds to a `Computing Task Count` (Red) on the FPGA, and every `Transfer` (Light Blue) corresponds to a `Transfer` (Blue) on the FPGA.
2. **Pipelined Execution:** The pattern in the Master Queue suggests a pipelined or alternating execution model, where compute phases are frequently interleaved with data transfer phases.
3. **High Memory Bandwidth:** The DRAM bandwidth is consistently high (~5.665 GB/sec), indicating the workload is memory-bound or has significant data movement requirements.
4. **Process Activity:** The `caffe.bin` thread (Row 3) is active in bursts that generally align with the compute phases in the Master Queue, confirming it is the source of the compute tasks.
5. **Anomaly/Unidentified Block:** The dark red/brown block in the Master Queue at ~5336.8-5337.2ms does not clearly match a primary legend color and may represent a context switch, synchronization event, or a different task priority.
### Interpretation
This trace captures a high-performance FPGA accelerator (Stratix 10) executing a deep learning inference workload (Caffe). The data demonstrates an efficient, tightly coupled system where the host CPU thread (`caffe.bin`) dispatches tasks to a hardware compute queue. The FPGA alternates rapidly between computation and data transfer, a pattern typical of layer-by-layer processing in neural networks where activations must be moved to/from memory.
The sustained high DRAM bandwidth is a critical performance indicator, showing the system is effectively utilizing its memory subsystem to feed the compute units. The near-constant activity of the hardware module (Row 2) suggests good utilization with minimal idle time. The primary bottleneck appears to be the alternation between compute and transfer; optimizing to overlap these operations further could potentially improve performance. The trace provides a micro-level view of system behavior, essential for identifying latency sources, verifying scheduling efficiency, and validating hardware-software co-design.
DECODING INTELLIGENCE...