## Screenshot: Performance Analysis Timeline
### Overview
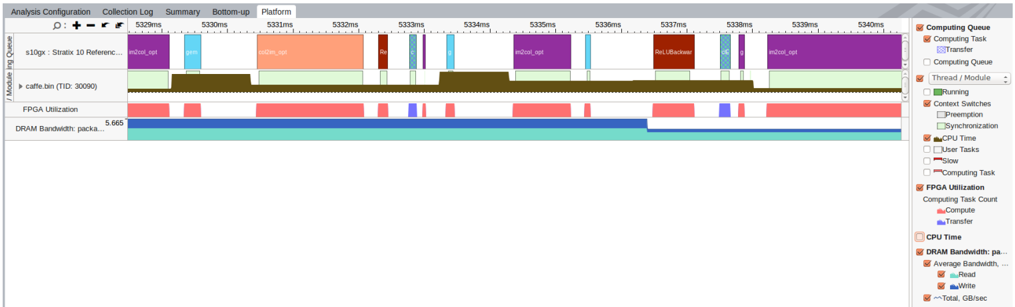
The image shows a performance analysis timeline from a system monitoring tool. It displays process execution timelines, resource utilization metrics, and task categorization over a 5334ms interval. The interface includes a legend for color-coded task types and a detailed view of process-level activity.
### Components/Axes
**Header Section:**
- Tabs: "Analysis Configuration", "Collection Log", "Summary", "Bottom-up", "Platform" (active tab)
- Toolbar: Magnification controls (+/-), zoom/reset icons
**Main Timeline Area:**
- **X-axis (Time):**
- Scale: 5329ms to 5340ms (11ms total)
- Markers: 5332ms, 5333ms, 5334ms, 5335ms, 5336ms, 5337ms, 5338ms, 5339ms, 5340ms
- **Y-axis (Processes):**
- Labels:
- "s10gx: Stratus 10 Reference..."
- "caffe.bin (TID: 30090)"
- "FPGA Utilization"
- "DRAM Bandwidth: packa..."
**Legend (Right Panel):**
- **Categories & Colors:**
- 🟦 Computing Queue
- 🟨 Computing Task
- 🟪 Transfer
- 🟫 Computing Queue
- 🟩 Running
- 🟨 Context Switches
- 🟦 Preemption
- 🟩 Synchronization
- 🟨 CPU Time
- 🟪 User Tasks
- 🟫 Slow
- 🟨 Computing Task
- 🟩 FPGA Utilization
- 🟨 Computing Task Count
- 🟪 CPU Time
- 🟨 DRAM Bandwidth
- 🟪 Read
- 🟩 Write
- 🟨 Total Bandwidth
- 🟪 GB/sec
### Detailed Analysis
**Process Activity:**
1. **s10gx: Stratus 10 Reference...**
- Purple blocks (Computing Task)
- Duration: 5333ms-5335ms
- Overlaps with "caffe.bin" execution
2. **caffe.bin (TID: 30090)**
- Green blocks (Running)
- Duration: 5332ms-5339ms
- Contains multiple nested task types:
- Red blocks (Compute)
- Blue blocks (Transfer)
- Brown blocks (Synchronization)
3. **FPGA Utilization**
- Long cyan block (FPGA Utilization)
- Duration: Entire timeline (5329ms-5340ms)
- Indicates sustained FPGA usage
4. **DRAM Bandwidth**
- Light blue block (DRAM Bandwidth)
- Duration: Entire timeline (5329ms-5340ms)
- Shows constant memory bandwidth usage
**Task Composition:**
- **Computing Tasks:**
- Purple blocks (inot_col_apt)
- Red blocks (caffe.bin)
- Brown blocks (caffe.bin)
- **Transfers:**
- Blue blocks (caffe.bin)
- Light blue blocks (DRAM Bandwidth)
- **Synchronization:**
- Brown blocks (caffe.bin)
### Key Observations
1. **Concurrency:** Multiple task types overlap within the 5333ms-5335ms window
2. **Resource Saturation:**
- FPGA and DRAM utilization lines run continuously
- Suggests hardware components operating at maximum capacity
3. **Task Prioritization:**
- "caffe.bin" process dominates timeline with multiple nested operations
- Contains both compute (red) and transfer (blue) phases
4. **Temporal Patterns:**
- Short-lived synchronization events (brown blocks)
- Regular compute/transfer cycles in caffe.bin execution
### Interpretation
This timeline reveals a complex system handling multiple concurrent operations:
- The persistent FPGA and DRAM utilization lines indicate hardware components operating at sustained maximum capacity
- The caffe.bin process demonstrates a typical machine learning inference pipeline with alternating compute and data transfer phases
- The purple "inot_col_apt" task suggests I/O operations occurring concurrently with compute tasks
- The brown synchronization blocks (likely GPU kernel launches) show brief but critical coordination points
The interface design effectively visualizes:
1. Task categorization through color coding
2. Temporal relationships between processes
3. Resource utilization patterns
4. Nested task structures within parent processes
Notable anomalies include the perfectly aligned start/end times of FPGA and DRAM utilization blocks, suggesting tightly coupled hardware operations. The overlapping task types within caffe.bin execution highlight the importance of understanding task dependencies in performance analysis.