## Line Chart: I-Don't-Know Rate vs. Layer for Llama Models
### Overview
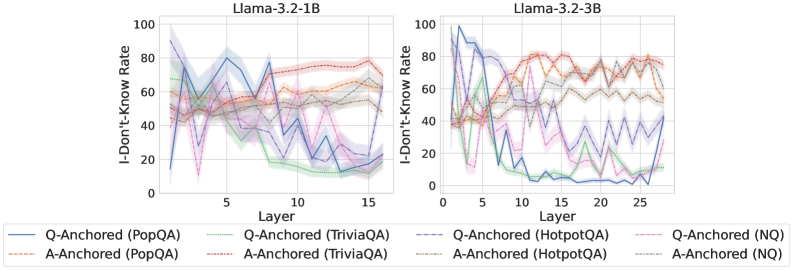
The image presents two line charts, side-by-side, depicting the "I-Don't-Know Rate" as a function of "Layer" for two different Llama models: Llama-3.2-1B and Llama-3.2-3B. Each chart displays multiple lines representing different question-answering datasets and anchoring methods. The charts are visually similar, showing a general decreasing trend in I-Don't-Know Rate with increasing layer number, but with significant fluctuations.
### Components/Axes
* **X-axis:** "Layer" - Ranges from 0 to 15 for the Llama-3.2-1B chart and 0 to 25 for the Llama-3.2-3B chart. The scale is linear.
* **Y-axis:** "I-Don't-Know Rate" - Ranges from 0 to 100. The scale is linear.
* **Title (Left Chart):** "Llama-3.2-1B"
* **Title (Right Chart):** "Llama-3.2-3B"
* **Legend:** Located at the bottom of the image, spanning both charts. The legend identifies the different lines based on anchoring method and dataset:
* Blue Line: Q-Anchored (PopQA)
* Orange Line: A-Anchored (PopQA)
* Green Line: Q-Anchored (TriviaQA)
* Red Line: A-Anchored (TriviaQA)
* Gray Line: Q-Anchored (HotpotQA)
* Purple Line: A-Anchored (HotpotQA)
* Light Blue Line: Q-Anchored (NQ)
* Brown Line: A-Anchored (NQ)
### Detailed Analysis or Content Details
**Llama-3.2-1B Chart:**
* **Q-Anchored (PopQA) (Blue):** Starts at approximately 90, rapidly decreases to around 20-30 by layer 5, then fluctuates between 20 and 40 until layer 15.
* **A-Anchored (PopQA) (Orange):** Starts at approximately 70, decreases to around 40-50 by layer 5, and remains relatively stable between 40 and 60 until layer 15.
* **Q-Anchored (TriviaQA) (Green):** Starts at approximately 70, decreases to around 20-30 by layer 5, then fluctuates between 20 and 40 until layer 15.
* **A-Anchored (TriviaQA) (Red):** Starts at approximately 80, decreases to around 50-60 by layer 5, and remains relatively stable between 50 and 70 until layer 15.
* **Q-Anchored (HotpotQA) (Gray):** Starts at approximately 60, decreases to around 30-40 by layer 5, and remains relatively stable between 30 and 50 until layer 15.
* **A-Anchored (HotpotQA) (Purple):** Starts at approximately 60, decreases to around 40-50 by layer 5, and remains relatively stable between 40 and 60 until layer 15.
* **Q-Anchored (NQ) (Light Blue):** Starts at approximately 60, decreases to around 20-30 by layer 5, then fluctuates between 20 and 40 until layer 15.
* **A-Anchored (NQ) (Brown):** Starts at approximately 60, decreases to around 40-50 by layer 5, and remains relatively stable between 40 and 60 until layer 15.
**Llama-3.2-3B Chart:**
* **Q-Anchored (PopQA) (Blue):** Starts at approximately 90, rapidly decreases to around 10-20 by layer 5, then fluctuates between 10 and 30 until layer 25.
* **A-Anchored (PopQA) (Orange):** Starts at approximately 70, decreases to around 40-50 by layer 5, and remains relatively stable between 40 and 60 until layer 25.
* **Q-Anchored (TriviaQA) (Green):** Starts at approximately 70, decreases to around 20-30 by layer 5, then fluctuates between 20 and 40 until layer 25.
* **A-Anchored (TriviaQA) (Red):** Starts at approximately 80, decreases to around 50-60 by layer 5, and remains relatively stable between 50 and 70 until layer 25.
* **Q-Anchored (HotpotQA) (Gray):** Starts at approximately 60, decreases to around 30-40 by layer 5, and remains relatively stable between 30 and 50 until layer 25.
* **A-Anchored (HotpotQA) (Purple):** Starts at approximately 60, decreases to around 40-50 by layer 5, and remains relatively stable between 40 and 60 until layer 25.
* **Q-Anchored (NQ) (Light Blue):** Starts at approximately 60, decreases to around 20-30 by layer 5, then fluctuates between 20 and 40 until layer 25.
* **A-Anchored (NQ) (Brown):** Starts at approximately 60, decreases to around 40-50 by layer 5, and remains relatively stable between 40 and 60 until layer 25.
### Key Observations
* Both charts show a significant decrease in I-Don't-Know Rate in the initial layers (0-5).
* The Q-Anchored lines generally exhibit lower I-Don't-Know Rates than the A-Anchored lines, especially in the Llama-3.2-3B chart.
* The Llama-3.2-3B model consistently demonstrates lower I-Don't-Know Rates across all datasets and anchoring methods compared to the Llama-3.2-1B model.
* The I-Don't-Know Rate stabilizes after layer 5 for most datasets and anchoring methods, indicating diminishing returns in reducing uncertainty with increasing layers.
* PopQA consistently shows lower I-Don't-Know rates than TriviaQA, HotpotQA, and NQ.
### Interpretation
The data suggests that increasing the number of layers in the Llama models initially reduces the model's uncertainty (as measured by the I-Don't-Know Rate). However, this improvement plateaus after a certain number of layers. The difference in performance between the Llama-3.2-1B and Llama-3.2-3B models indicates that increasing model size (number of parameters) leads to a more confident and knowledgeable model.
The consistent lower I-Don't-Know Rates for Q-Anchored methods suggest that anchoring questions is more effective than anchoring answers in reducing uncertainty. The performance differences across datasets (PopQA, TriviaQA, HotpotQA, NQ) likely reflect the inherent difficulty and complexity of each dataset. PopQA appears to be the easiest dataset, while NQ is the most challenging.
The fluctuations in the I-Don't-Know Rate after layer 5 could be due to overfitting, noise in the data, or the model's ability to identify genuinely unanswerable questions. Further investigation would be needed to determine the underlying cause of these fluctuations.