## Line Charts: I-Don't-Know Rate Across Model Layers
### Overview
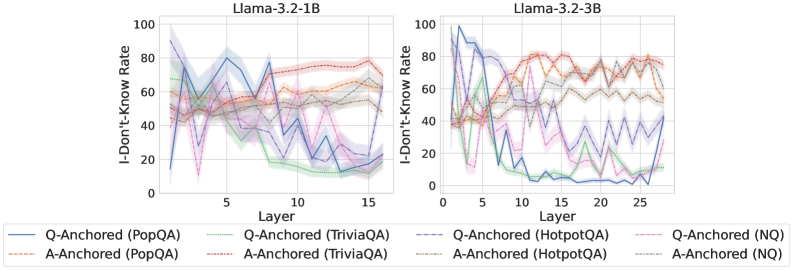
The image displays two side-by-side line charts comparing the "I-Don't-Know Rate" across the layers of two different language models: Llama-3.2-1B (left) and Llama-3.2-3B (right). The charts track how this rate changes for different question-answering datasets under two anchoring conditions (Q-Anchored and A-Anchored).
### Components/Axes
* **Titles:**
* Left Chart: `Llama-3.2-1B`
* Right Chart: `Llama-3.2-3B`
* **Y-Axis (Both Charts):** Label: `I-Don't-Know Rate`. Scale: 0 to 100, with major tick marks at 0, 20, 40, 60, 80, 100.
* **X-Axis (Both Charts):** Label: `Layer`.
* Left Chart Scale: 0 to 15, with major tick marks at 0, 5, 10, 15.
* Right Chart Scale: 0 to 25, with major tick marks at 0, 5, 10, 15, 20, 25.
* **Legend (Bottom, spanning both charts):** Contains 8 entries, differentiating lines by color and style (solid vs. dashed).
* **Solid Lines (Q-Anchored):**
* Blue: `Q-Anchored (PopQA)`
* Green: `Q-Anchored (TriviaQA)`
* Purple: `Q-Anchored (HotpotQA)`
* Pink: `Q-Anchored (NQ)`
* **Dashed Lines (A-Anchored):**
* Orange: `A-Anchored (PopQA)`
* Red: `A-Anchored (TriviaQA)`
* Brown: `A-Anchored (HotpotQA)`
* Gray: `A-Anchored (NQ)`
### Detailed Analysis
**Chart 1: Llama-3.2-1B**
* **Q-Anchored Lines (Solid):** All four solid lines show a general **downward trend** as layer number increases.
* They start with high variability and high rates (between ~40% and ~90%) in the early layers (0-5).
* They converge and decline significantly after layer 5, ending in a tighter cluster between approximately 10% and 30% by layer 15.
* The blue line (PopQA) shows the most dramatic drop, from near 90% to below 20%.
* **A-Anchored Lines (Dashed):** All four dashed lines show a relatively **stable or slightly increasing trend**.
* They start in a middle range (between ~40% and ~60%) and remain within a band of approximately 50% to 80% across all layers.
* There is less dramatic change compared to the Q-Anchored lines. The red line (TriviaQA) appears to be among the highest, ending near 80%.
**Chart 2: Llama-3.2-3B**
* **Q-Anchored Lines (Solid):** The downward trend is **more pronounced and steeper** than in the 1B model.
* Starting from high and variable points (some near 100%), they drop sharply after layer 5.
* By layer 15, most Q-Anchored lines have fallen to very low rates, with several approaching or reaching 0%. The blue (PopQA) and green (TriviaQA) lines are notably close to 0% from layer 10 onward.
* The lines show more volatility (sharp spikes and dips) compared to the 1B model.
* **A-Anchored Lines (Dashed):** These lines maintain a **high and relatively stable trend**, similar to the 1B model but with more pronounced fluctuations.
* They generally occupy the upper portion of the chart, mostly between 60% and 80%.
* The red (TriviaQA) and orange (PopQA) dashed lines are consistently among the highest.
### Key Observations
1. **Anchoring Effect:** There is a stark and consistent difference between Q-Anchored (solid) and A-Anchored (dashed) conditions across both models. Q-Anchoring leads to a decreasing "I-Don't-Know" rate with depth, while A-Anchoring maintains a high rate.
2. **Model Size Effect:** The larger model (3B) exhibits a more extreme version of the trends seen in the smaller model (1B). The decline for Q-Anchored lines is steeper and reaches lower final values, and the fluctuations are more dramatic.
3. **Layer Dependency:** The critical transition for Q-Anchored lines appears to happen after layer 5 in both models.
4. **Dataset Variation:** While the overall trend by anchoring type is dominant, there is variation between datasets. For example, A-Anchored TriviaQA (red dashed) often has the highest rate, while Q-Anchored PopQA (blue solid) often shows the most dramatic decline.
### Interpretation
This data suggests a fundamental difference in how the model processes information depending on the anchoring prompt. **Q-Anchoring** (likely prompting with the question) appears to activate the model's internal knowledge progressively through its layers, reducing uncertainty ("I-Don't-Know") as information is processed deeper in the network. This effect is stronger in the larger model.
Conversely, **A-Anchoring** (likely prompting with a potential answer) seems to keep the model in a state of higher uncertainty throughout its processing depth. This could indicate that this prompting style does not effectively engage the knowledge retrieval pathways, or it may trigger a more cautious, verification-oriented process that maintains a high "I-Don't-Know" rate.
The charts provide visual evidence that the method of prompting (anchoring) has a more significant impact on this uncertainty metric than the specific knowledge dataset (PopQA, TriviaQA, etc.) or even the model size, although model size amplifies the observed effects. The clear layer-wise progression for Q-Anchored lines offers insight into the sequential nature of knowledge processing within the transformer architecture.