## Line Chart: I-Don't-Know Rate Across Llama-3.2 Models and Layers
### Overview
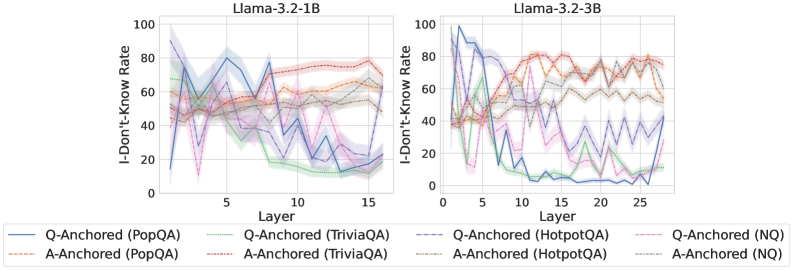
The image contains two line charts comparing the "I-Don't-Know Rate" (percentage of instances where models failed to answer) across different layers of the Llama-3.2-1B and Llama-3.2-3B models. Each chart includes multiple data series representing Q-Anchored and A-Anchored models trained on various datasets (PopQA, TriviaQA, HotpotQA, NQ). The y-axis ranges from 0% to 100%, and the x-axis represents layer numbers (0–15 for 1B, 0–25 for 3B).
### Components/Axes
- **Y-Axis**: "I-Don't-Know Rate" (%), labeled vertically with ticks at 0, 20, 40, 60, 80, 100.
- **X-Axis**: "Layer" (layer numbers), labeled horizontally with ticks at 0, 5, 10, 15 (for 1B) and 0, 5, 10, 15, 20, 25 (for 3B).
- **Legend**: Located at the bottom, with six data series:
- **Q-Anchored (PopQA)**: Solid blue line.
- **A-Anchored (PopQA)**: Dashed orange line.
- **Q-Anchored (TriviaQA)**: Solid green line.
- **A-Anchored (TriviaQA)**: Dashed brown line.
- **Q-Anchored (HotpotQA)**: Solid purple line.
- **A-Anchored (NQ)**: Dashed pink line.
### Detailed Analysis
#### Llama-3.2-1B Chart
- **Q-Anchored (PopQA)**: Starts at ~80% in layer 0, fluctuates sharply, peaking at ~90% in layer 5, then drops to ~40% by layer 15.
- **A-Anchored (PopQA)**: Starts at ~60%, remains relatively stable (~50–70%) with minor fluctuations.
- **Q-Anchored (TriviaQA)**: Begins at ~70%, dips to ~30% in layer 5, then rises to ~60% by layer 15.
- **A-Anchored (TriviaQA)**: Starts at ~50%, fluctuates between ~40–60% with a peak at ~70% in layer 10.
- **Q-Anchored (HotpotQA)**: Starts at ~85%, drops to ~30% in layer 5, then rises to ~70% by layer 15.
- **A-Anchored (NQ)**: Starts at ~50%, remains stable (~40–60%) with a sharp drop to ~20% in layer 15.
#### Llama-3.2-3B Chart
- **Q-Anchored (PopQA)**: Starts at ~90%, fluctuates wildly, peaking at ~100% in layer 5, then drops to ~30% by layer 25.
- **A-Anchored (PopQA)**: Starts at ~60%, remains stable (~50–70%) with minor fluctuations.
- **Q-Anchored (TriviaQA)**: Begins at ~80%, dips to ~20% in layer 5, then rises to ~70% by layer 25.
- **A-Anchored (TriviaQA)**: Starts at ~50%, fluctuates between ~40–60% with a peak at ~70% in layer 10.
- **Q-Anchored (HotpotQA)**: Starts at ~95%, drops to ~20% in layer 5, then rises to ~80% by layer 25.
- **A-Anchored (NQ)**: Starts at ~50%, remains stable (~40–60%) with a sharp drop to ~10% in layer 25.
### Key Observations
1. **Model Size Differences**:
- The 3B model exhibits more extreme fluctuations (e.g., Q-Anchored lines reach 100% in layer 5) compared to the 1B model.
- The 1B model shows smoother trends, with fewer extreme peaks/troughs.
2. **Dataset Performance**:
- **NQ (A-Anchored)**: Consistently lower I-Don't-Know rates across layers, suggesting better generalization.
- **HotpotQA (Q-Anchored)**: High variability in the 3B model, with sharp drops and spikes.
3. **Layer-Specific Trends**:
- Early layers (0–5) show higher I-Don't-Know rates for Q-Anchored models, possibly due to insufficient training depth.
- Later layers (15–25) for the 3B model exhibit recovery in performance, though with persistent volatility.
### Interpretation
The data suggests that **Q-Anchored models** (trained with question-specific anchoring) are more sensitive to layer depth, showing higher variability and extreme I-Don't-Know rates in early layers. In contrast, **A-Anchored models** (trained with answer-specific anchoring) demonstrate greater stability, though their performance is still influenced by dataset complexity.
- **NQ (A-Anchored)** outperforms other datasets, indicating that answer-specific anchoring may better handle general knowledge tasks.
- The **3B model's volatility** (e.g., Q-Anchored lines reaching 100%) highlights potential overfitting or instability in deeper layers, possibly due to increased model complexity.
- The **1B model's smoother trends** suggest better generalization across layers, though its lower capacity may limit performance on complex tasks.
This analysis underscores the trade-off between model size and stability, with A-Anchored models offering more consistent performance at the cost of lower peak capabilities.