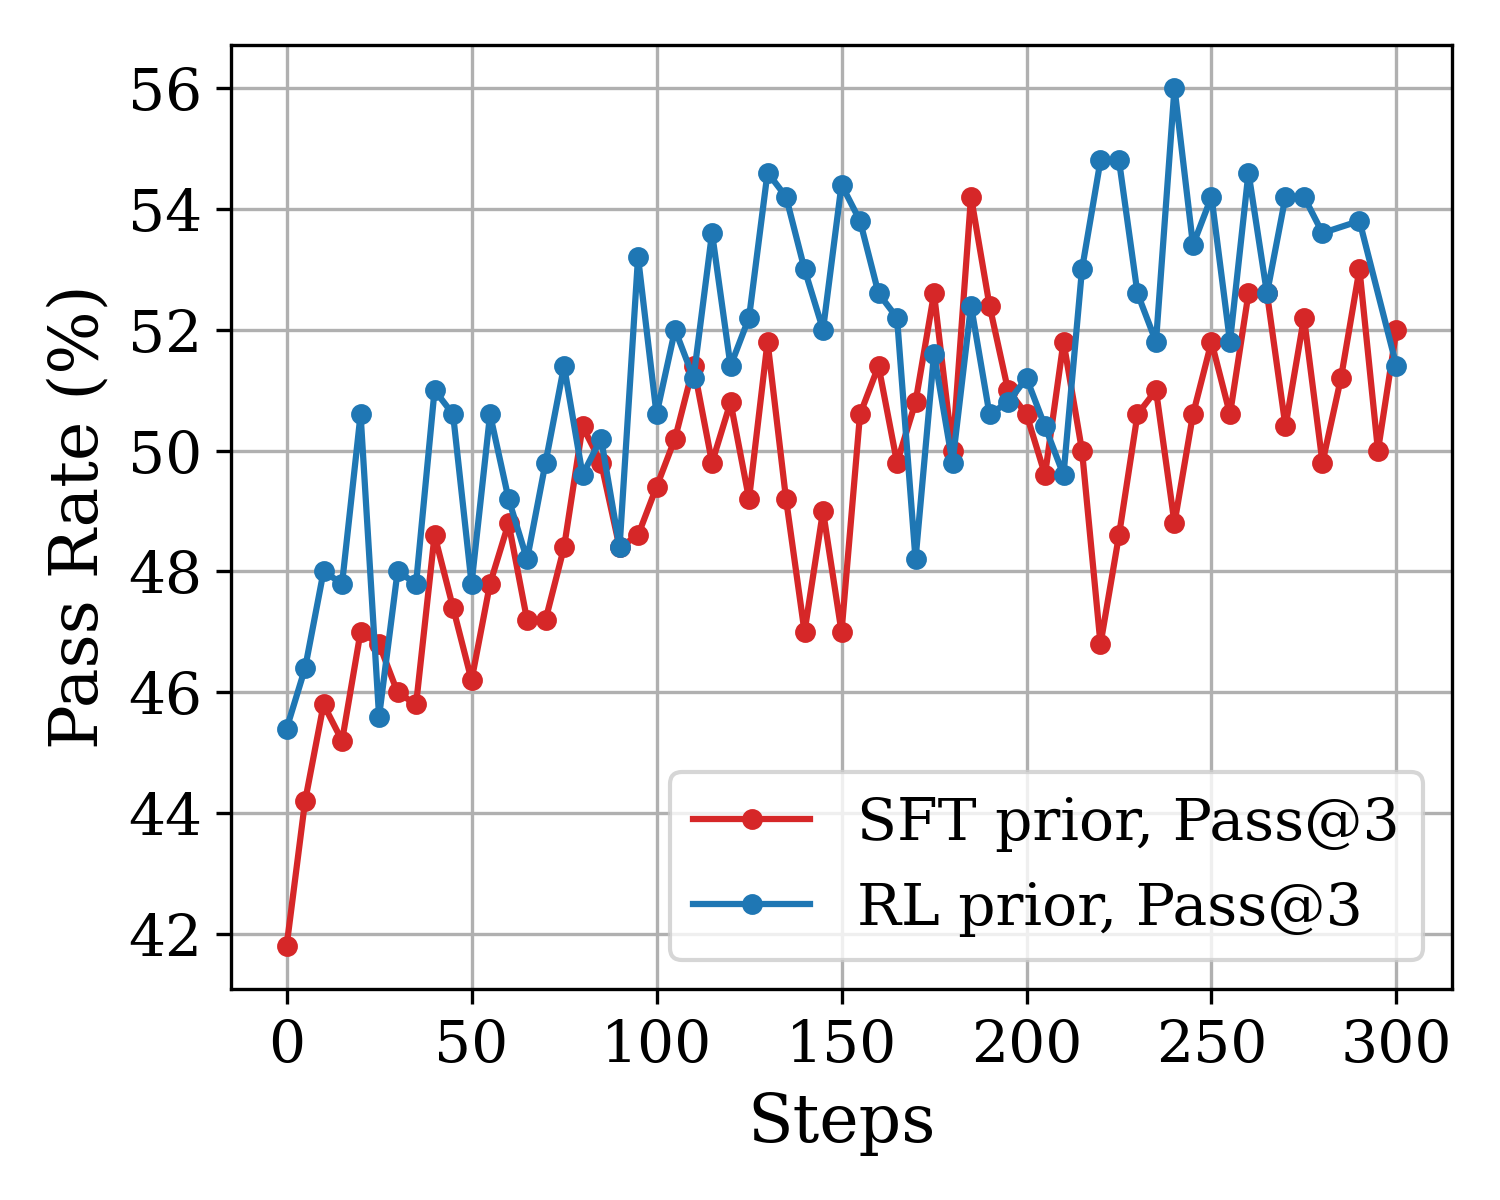
## Line Chart: Pass Rate vs. Steps
### Overview
The image is a line chart comparing the "Pass Rate (%)" against "Steps" for two different methods: "SFT prior, Pass@3" and "RL prior, Pass@3". The chart displays how the pass rate changes over the number of steps for each method.
### Components/Axes
* **X-axis:** "Steps", with labeled markers at 0, 50, 100, 150, 200, 250, and 300.
* **Y-axis:** "Pass Rate (%)", with labeled markers at 42, 44, 46, 48, 50, 52, 54, and 56.
* **Legend:** Located in the bottom-right of the chart.
* Red line: "SFT prior, Pass@3"
* Blue line: "RL prior, Pass@3"
* The chart has a grid for easier reading of values.
### Detailed Analysis
* **SFT prior, Pass@3 (Red Line):**
* The line starts at approximately 42% at 0 steps.
* The line generally slopes upward from 0 to 100 steps.
* At 50 steps, the value is approximately 47%.
* At 100 steps, the value is approximately 49%.
* From 100 steps to 300 steps, the line fluctuates between approximately 47% and 52%.
* At 150 steps, the value is approximately 47%.
* At 200 steps, the value is approximately 51%.
* At 250 steps, the value is approximately 50%.
* At 300 steps, the value is approximately 51%.
* **RL prior, Pass@3 (Blue Line):**
* The line starts at approximately 45% at 0 steps.
* The line generally slopes upward from 0 to 150 steps.
* At 50 steps, the value is approximately 51%.
* At 100 steps, the value is approximately 53%.
* At 150 steps, the value is approximately 54%.
* From 150 steps to 300 steps, the line fluctuates between approximately 51% and 56%.
* At 200 steps, the value is approximately 52%.
* At 250 steps, the value is approximately 55%.
* At 300 steps, the value is approximately 54%.
### Key Observations
* The "RL prior, Pass@3" method generally outperforms the "SFT prior, Pass@3" method, showing a higher pass rate across most of the steps.
* Both methods show an initial increase in pass rate, but the "RL prior, Pass@3" method increases more rapidly.
* Both lines exhibit fluctuations, indicating variability in the pass rate as the number of steps increases.
### Interpretation
The chart suggests that using "RL prior, Pass@3" leads to a better pass rate compared to "SFT prior, Pass@3". The initial rapid increase in the "RL prior, Pass@3" method indicates a faster learning or adaptation rate. The fluctuations in both lines could be due to the inherent stochasticity in the learning process or the complexity of the task. The data demonstrates the impact of different prior methods on the pass rate of a system, highlighting the importance of selecting an appropriate prior for optimal performance.