\n
## Line Chart: Pass Rate vs. Steps
### Overview
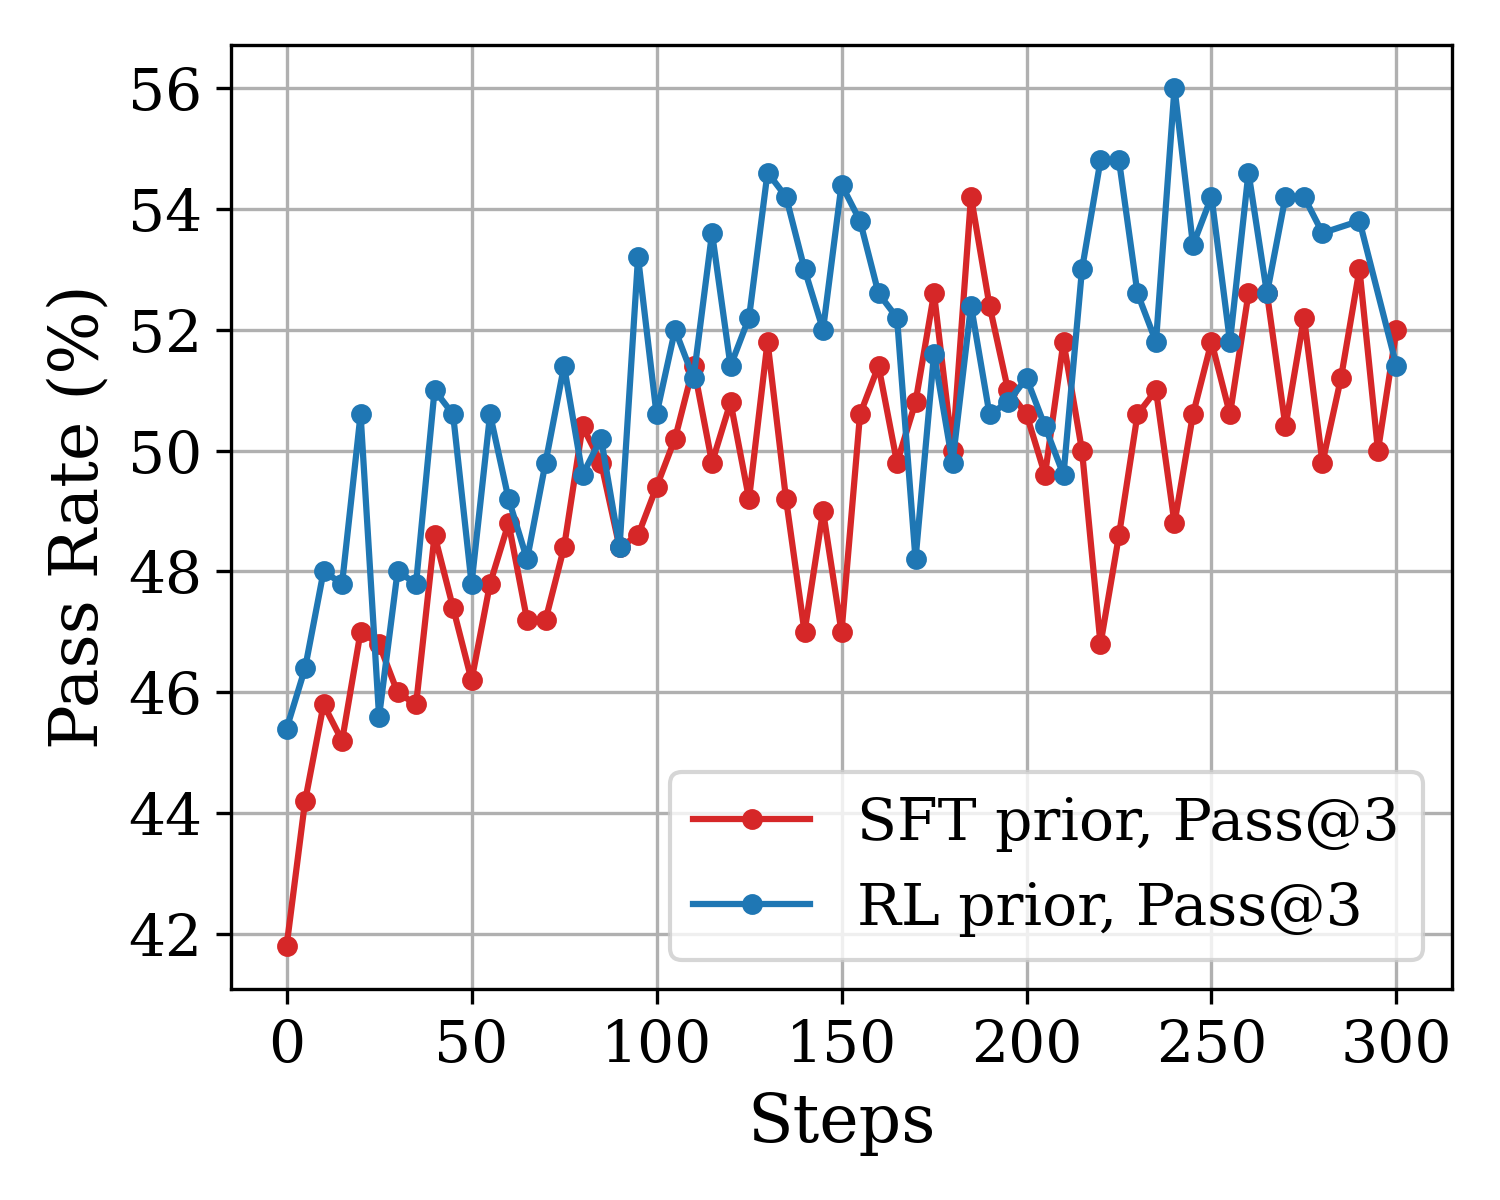
This image presents a line chart comparing the "Pass@3" rate of two models, "SFT prior" and "RL prior", over a range of "Steps" from 0 to 300. The chart visualizes the performance of each model as it progresses through training or evaluation steps, measured by the percentage of times it "passes" a certain criteria (Pass@3).
### Components/Axes
* **X-axis:** "Steps" - ranging from 0 to 300, with tick marks at intervals of 50.
* **Y-axis:** "Pass Rate (%)" - ranging from 42% to 56%, with tick marks at intervals of 2%.
* **Data Series 1:** "SFT prior, Pass@3" - represented by a red line with circular markers.
* **Data Series 2:** "RL prior, Pass@3" - represented by a blue line with circular markers.
* **Legend:** Located in the bottom-right corner, clearly labeling each data series with its corresponding color.
* **Grid:** A light gray grid is present in the background to aid in reading values.
### Detailed Analysis
**SFT prior, Pass@3 (Red Line):**
The red line starts at approximately 42% at Step 0 and generally increases until around Step 50, reaching approximately 49%. It then fluctuates between approximately 47% and 52% for the remainder of the steps, with some dips below 47% around Step 150 and Step 250.
* Step 0: ~42%
* Step 50: ~49%
* Step 100: ~48%
* Step 150: ~47%
* Step 200: ~50%
* Step 250: ~47%
* Step 300: ~50%
**RL prior, Pass@3 (Blue Line):**
The blue line starts at approximately 45% at Step 0 and increases more rapidly than the red line, reaching approximately 53% at Step 50. It continues to fluctuate, generally remaining above the red line, with peaks around 55% at Step 100 and Step 250.
* Step 0: ~45%
* Step 50: ~53%
* Step 100: ~55%
* Step 150: ~52%
* Step 200: ~53%
* Step 250: ~55%
* Step 300: ~54%
### Key Observations
* The "RL prior" model consistently achieves a higher "Pass@3" rate than the "SFT prior" model across all steps.
* Both models exhibit fluctuations in their "Pass@3" rates, suggesting instability or sensitivity to the training process.
* The "RL prior" model shows a more rapid initial increase in "Pass@3" rate compared to the "SFT prior" model.
* The "SFT prior" model experiences a noticeable dip in "Pass@3" rate around Step 250, while the "RL prior" model remains relatively stable.
### Interpretation
The chart demonstrates that the "RL prior" model outperforms the "SFT prior" model in terms of "Pass@3" rate. This suggests that the reinforcement learning approach (RL prior) is more effective in achieving the desired outcome (passing the criteria) than the supervised fine-tuning approach (SFT prior). The fluctuations in both lines indicate that the training process is not entirely smooth and may require further optimization or regularization. The initial rapid increase in the "RL prior" model suggests that it learns quickly, while the later stability indicates that it converges to a relatively consistent performance level. The dip in the "SFT prior" model around Step 250 could be due to a variety of factors, such as a change in the training data or a temporary instability in the learning process. Further investigation would be needed to determine the root cause of this dip. The "Pass@3" metric likely refers to the percentage of times the model passes a specific test or evaluation after 3 attempts, indicating a measure of robustness or reliability.