## Line Chart: Pass Rate (%) vs. Training Steps for Two Prior Methods
### Overview
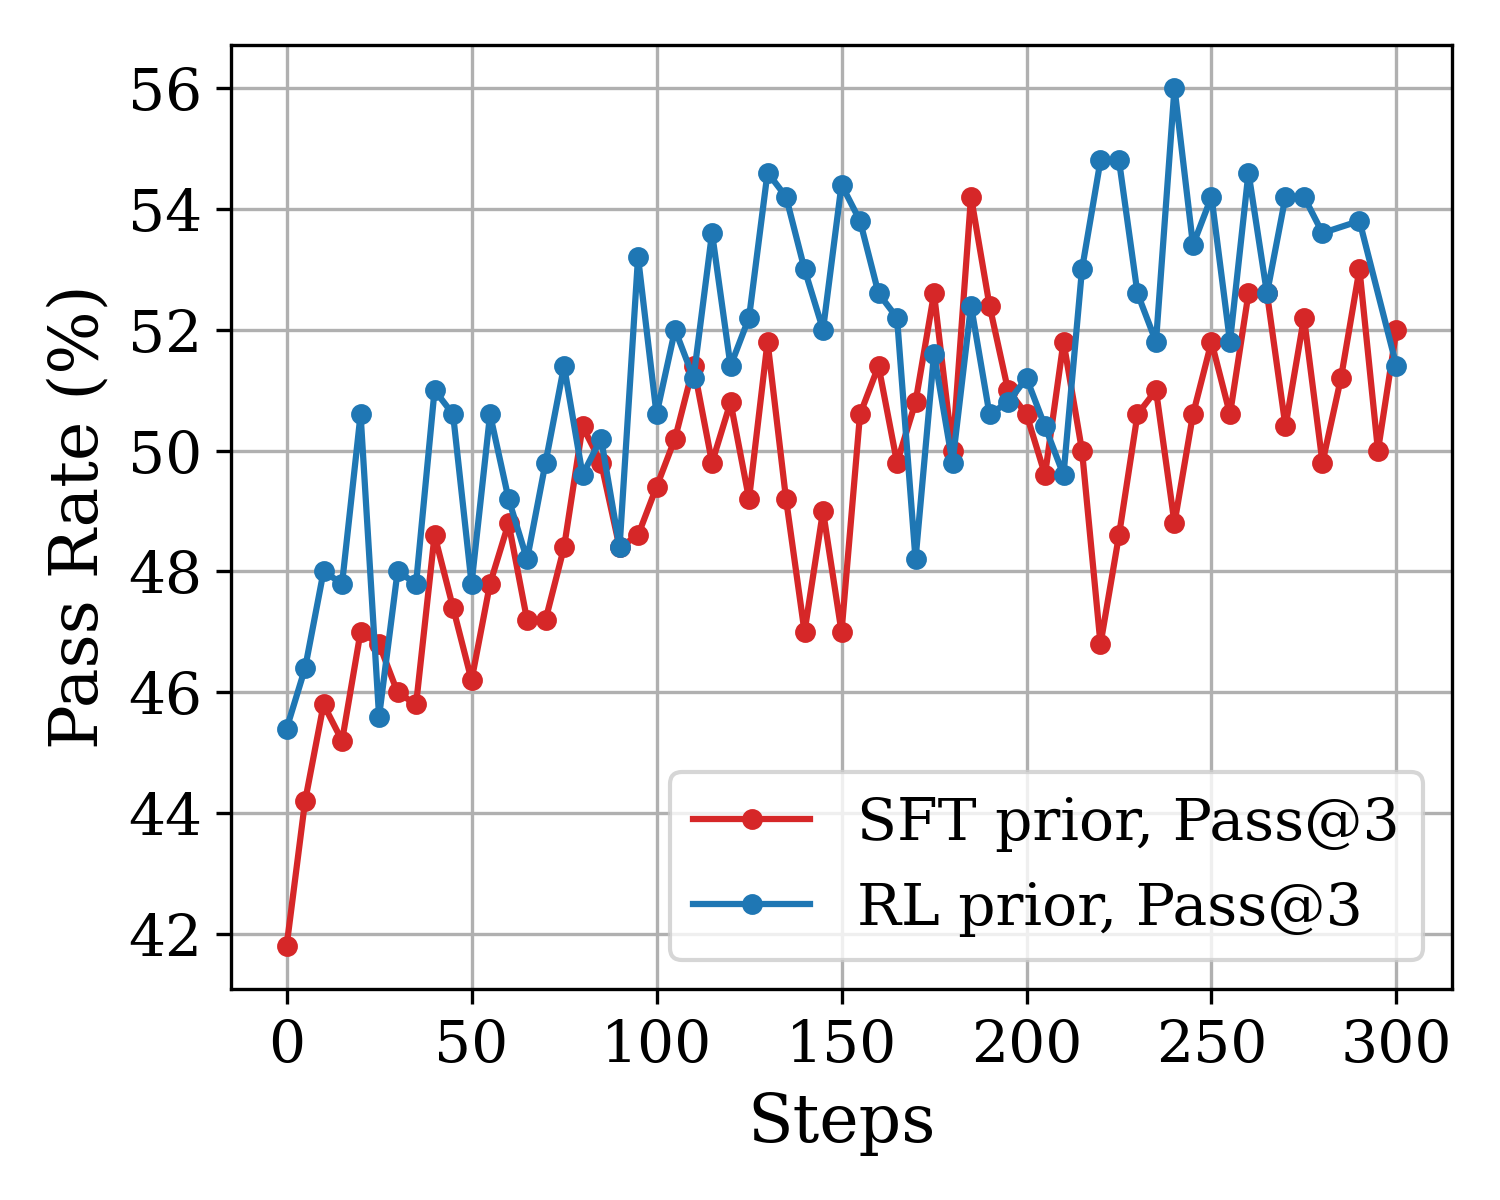
The image is a line chart comparing the performance of two different prior methods—SFT (Supervised Fine-Tuning) and RL (Reinforcement Learning)—over the course of training steps. The performance metric is the "Pass Rate (%)" for a "Pass@3" evaluation. The chart shows the progression of this metric for both methods from step 0 to step 300.
### Components/Axes
* **Chart Type:** Line chart with markers.
* **X-Axis:**
* **Label:** "Steps"
* **Scale:** Linear, from 0 to 300.
* **Major Ticks:** 0, 50, 100, 150, 200, 250, 300.
* **Y-Axis:**
* **Label:** "Pass Rate (%)"
* **Scale:** Linear, from 42 to 56.
* **Major Ticks:** 42, 44, 46, 48, 50, 52, 54, 56.
* **Legend:**
* **Position:** Bottom-right corner of the plot area.
* **Series 1:** Red line with circular markers, labeled "SFT prior, Pass@3".
* **Series 2:** Blue line with circular markers, labeled "RL prior, Pass@3".
* **Grid:** A light gray grid is present for both major x and y ticks.
### Detailed Analysis
**Data Series 1: SFT prior, Pass@3 (Red Line)**
* **Trend:** Shows a general upward trend with significant volatility. It starts at the lowest point on the chart and ends at a high level, but with notable dips.
* **Key Data Points (Approximate):**
* Step 0: ~42.0% (lowest point for this series)
* Step ~180: ~54.2% (peak for this series)
* Step 300: ~52.0%
* Notable dip at Step ~220: ~46.8%
**Data Series 2: RL prior, Pass@3 (Blue Line)**
* **Trend:** Also shows a general upward trend with high volatility. It starts higher than the SFT series and achieves the highest overall value on the chart.
* **Key Data Points (Approximate):**
* Step 0: ~45.5%
* Step ~240: ~56.0% (highest point on the entire chart)
* Step 300: ~51.5%
* Notable dip at Step ~170: ~48.2%
### Key Observations
1. **Initial Performance Gap:** At step 0, the RL prior method starts with a pass rate approximately 3.5 percentage points higher than the SFT prior method.
2. **Overall Improvement:** Both methods demonstrate a clear improvement in pass rate over the 300 training steps.
3. **Volatility:** Both data series are highly volatile, with frequent sharp increases and decreases between consecutive measured steps.
4. **Peak Performance:** The RL prior method achieves the highest recorded pass rate (~56%) at approximately step 240. The SFT prior method's peak (~54.2%) occurs earlier, around step 180.
5. **Convergence and Divergence:** The two lines frequently cross each other, indicating periods where one method outperforms the other. However, the RL prior line is generally above the SFT prior line for the majority of the training steps, especially in the first half.
6. **Final Values:** By step 300, the performance of both methods is relatively close, with SFT prior at ~52% and RL prior at ~51.5%.
### Interpretation
This chart likely visualizes the training progress of two different AI model initialization or training strategies ("priors") on a task where success is measured by a "Pass@3" rate (e.g., solving a problem correctly in at least 3 out of 3 attempts).
* **What the data suggests:** The Reinforcement Learning (RL) prior appears to provide a stronger starting point and leads to a higher maximum performance ceiling compared to the Supervised Fine-Tuning (SFT) prior. However, both methods are effective at improving the model's capability over time.
* **Relationship between elements:** The "Steps" axis represents training iterations. The upward trend in "Pass Rate" for both lines confirms that training is effective. The volatility suggests the training process is noisy or the evaluation metric is sensitive to small model changes.
* **Notable patterns/anomalies:** The significant dips (e.g., SFT at step ~220, RL at step ~170) could indicate periods of training instability, catastrophic forgetting, or challenging batches of training data. The fact that both methods recover from these dips shows robustness. The RL prior's ability to reach a higher peak suggests it may be better at escaping local optima or finding a more optimal policy for the task.