# Technical Document Extraction: Line Chart Analysis
## Chart Overview
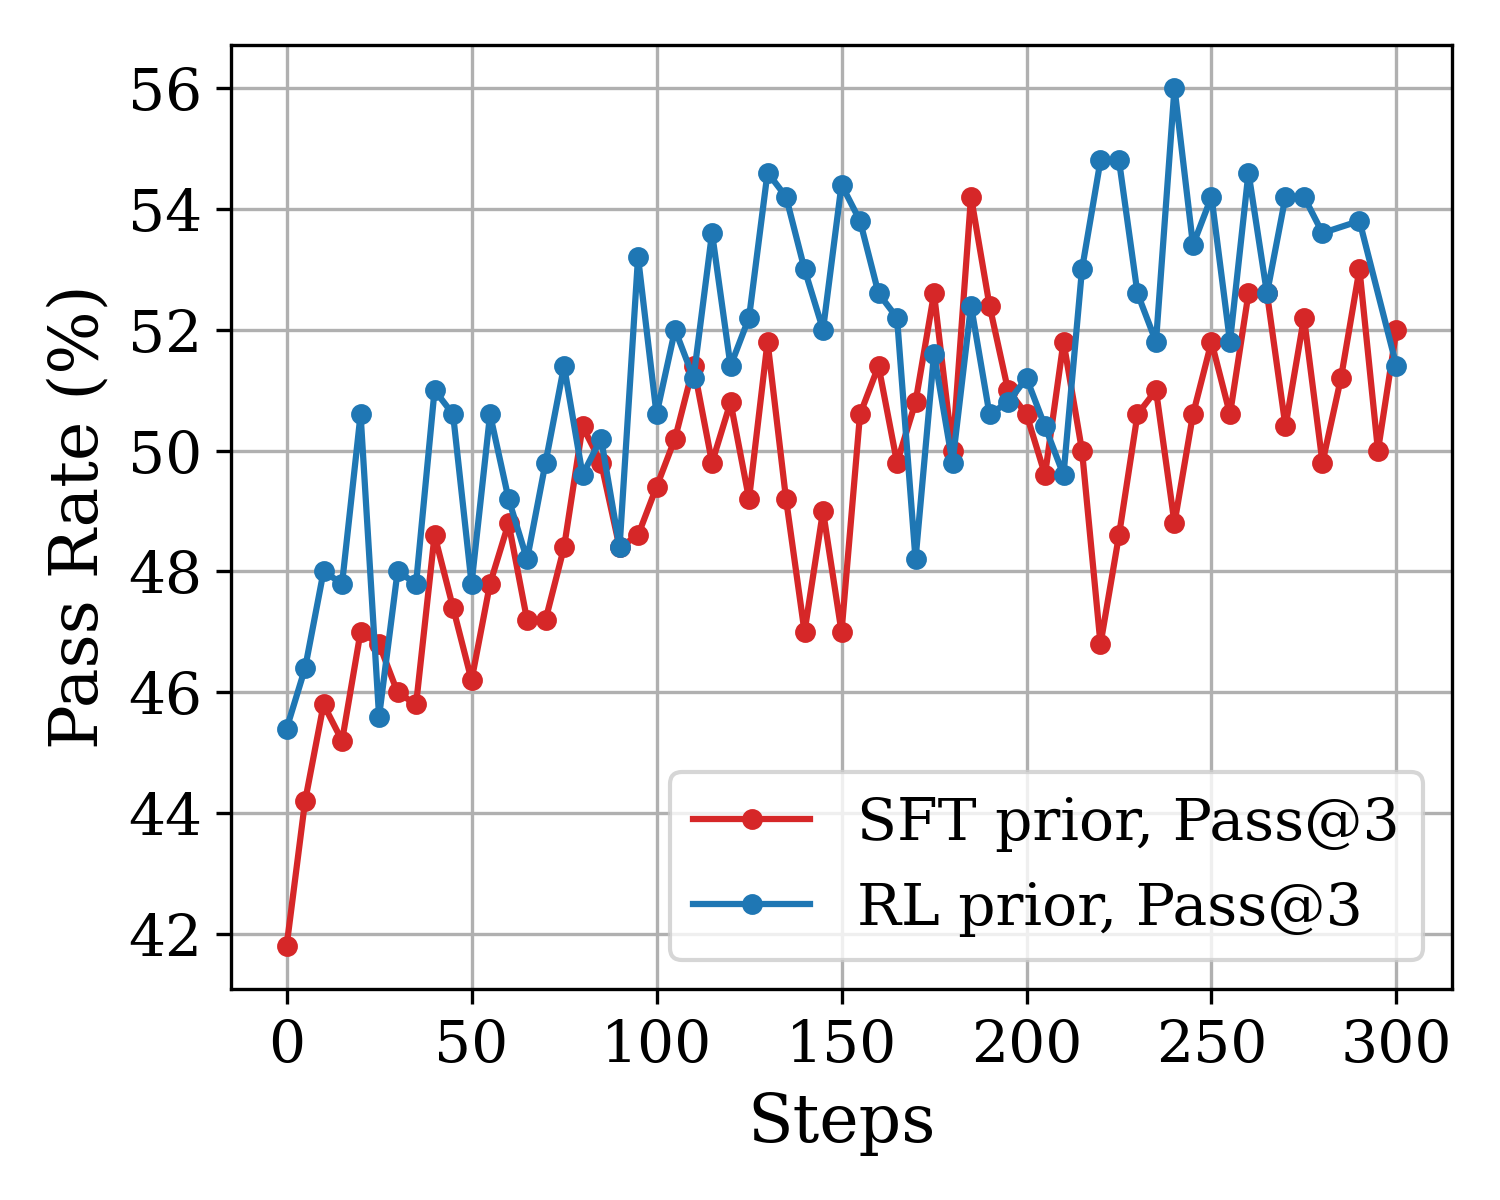
The image depicts a **line chart** comparing two data series over a sequence of steps. The chart visualizes the relationship between **Steps** (x-axis) and **Pass Rate (%)** (y-axis), with two distinct data series differentiated by color and labeled in the legend.
---
### Axis Labels and Markers
- **X-Axis (Steps)**:
- Title: "Steps"
- Range: 0 to 300
- Increment: 50 (0, 50, 100, 150, 200, 250, 300)
- **Y-Axis (Pass Rate %)**:
- Title: "Pass Rate (%)"
- Range: 42% to 56%
- Increment: 2% (42%, 44%, 46%, 48%, 50%, 52%, 54%, 56%)
---
### Legend
- **Location**: Bottom-right corner of the chart
- **Entries**:
1. **Red Dots**: "SFT prior, Pass@3"
2. **Blue Dots**: "RL prior, Pass@3"
---
### Data Series Analysis
#### 1. SFT Prior (Red Line)
- **Initial Value**: Starts at **42%** (Step 0)
- **Trend**:
- Gradual upward trajectory until **Step 100** (~48%).
- Sharp peak at **Step 200** (~54%).
- Post-Step 200: Fluctuates between **48%–54%**, ending at **52%** (Step 300).
- **Key Data Points**:
- Step 0: 42%
- Step 50: 46%
- Step 100: 48%
- Step 150: 50%
- Step 200: 54%
- Step 250: 50%
- Step 300: 52%
#### 2. RL Prior (Blue Line)
- **Initial Value**: Starts at **45%** (Step 0)
- **Trend**:
- Steeper initial rise compared to SFT, peaking at **Step 250** (~56%).
- Post-Step 250: Declines to **52%** (Step 300).
- **Key Data Points**:
- Step 0: 45%
- Step 50: 50%
- Step 100: 52%
- Step 150: 54%
- Step 200: 56%
- Step 250: 56%
- Step 300: 52%
---
### Cross-Reference Validation
- **Color Consistency**:
- Red data points (SFT) and blue data points (RL) align with the legend.
- **Legend Placement**: Confirmed at bottom-right, ensuring clarity for both series.
---
### Observations
1. **SFT Prior** exhibits moderate growth with volatility, peaking mid-chart.
2. **RL Prior** demonstrates sharper initial growth, surpassing SFT, but declines slightly by Step 300.
3. Both series converge near **52%** at Step 300, suggesting similar performance at later steps.
---
### Conclusion
The chart highlights divergent performance trends between SFT and RL priors, with RL achieving higher pass rates initially but both stabilizing near 52% by Step 300. No additional textual or tabular data is present in the image.