\n
## Line Chart: Critic Rewards Mean
### Overview
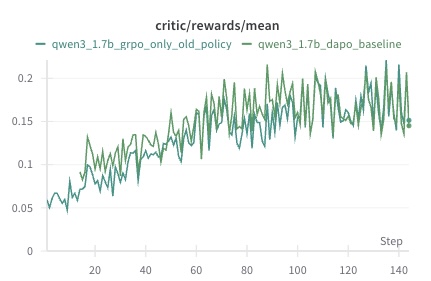
This image presents a line chart displaying the mean rewards over steps for two different policies: `qwen3_1.7b_grpo_only_old_policy` and `qwen3_1.7b_dapo_baseline`. The chart visualizes the performance of these policies over a series of steps, with the y-axis representing the mean reward and the x-axis representing the step number.
### Components/Axes
* **Title:** `critic/rewards/mean` (located at the top-center)
* **X-axis:** `Step` (located at the bottom-right) - Scale ranges from approximately 0 to 140.
* **Y-axis:** No explicit label, but represents the mean reward. Scale ranges from approximately 0.04 to 0.22.
* **Legend:** Located at the top-left.
* `qwen3_1.7b_grpo_only_old_policy` - represented by a dark green line.
* `qwen3_1.7b_dapo_baseline` - represented by a lighter green line.
### Detailed Analysis
The chart displays two fluctuating lines representing the mean rewards for each policy over the steps.
**qwen3_1.7b_grpo_only_old_policy (Dark Green Line):**
The line generally slopes upward from step 0 to approximately step 60, then fluctuates with a relatively stable mean.
* Step 0: Approximately 0.05
* Step 20: Approximately 0.08
* Step 40: Approximately 0.12
* Step 60: Approximately 0.16
* Step 80: Approximately 0.17
* Step 100: Approximately 0.16
* Step 120: Approximately 0.18
* Step 140: Approximately 0.14
**qwen3_1.7b_dapo_baseline (Light Green Line):**
This line also shows an upward trend initially, but with more pronounced fluctuations.
* Step 0: Approximately 0.05
* Step 20: Approximately 0.07
* Step 40: Approximately 0.11
* Step 60: Approximately 0.16
* Step 80: Approximately 0.19
* Step 100: Approximately 0.15
* Step 120: Approximately 0.17
* Step 140: Approximately 0.14
### Key Observations
* Both policies exhibit an initial increase in mean reward.
* The `qwen3_1.7b_dapo_baseline` policy shows greater volatility in its reward signal compared to the `qwen3_1.7b_grpo_only_old_policy`.
* After approximately step 60, the rewards for both policies stabilize, fluctuating around a mean value of approximately 0.16-0.19.
* There is no clear indication of one policy consistently outperforming the other throughout the entire duration.
### Interpretation
The chart suggests that both policies are learning and improving their performance over time, as evidenced by the initial increase in mean rewards. The fluctuations in the reward signal indicate the stochastic nature of the learning process. The `qwen3_1.7b_dapo_baseline` policy's higher volatility might suggest a more exploratory learning strategy, while the `qwen3_1.7b_grpo_only_old_policy` policy might be more conservative. The stabilization of rewards after step 60 could indicate that both policies have converged to a local optimum or reached a point of diminishing returns. Further analysis would be needed to determine the statistical significance of any observed differences in performance. The title "critic/rewards/mean" suggests this data is related to a reinforcement learning setup, where the "critic" is evaluating the quality of actions taken by an agent.