## Line Graph: critic/rewards/mean
### Overview
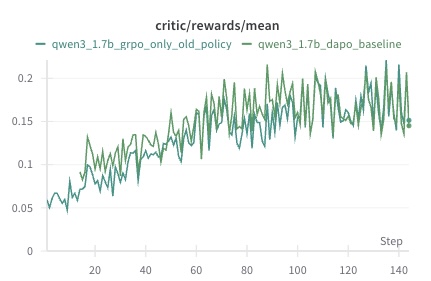
The image is a line graph comparing two data series over a sequence of steps. The graph shows the mean critic/rewards metric for two configurations of a model (qwen3_1.7b) across 140 steps. The data series are labeled in the legend as "qwen3_1.7b_grpo_only_old_policy" (teal) and "qwen3_1.7b_dapo_baseline" (green). Both lines exhibit fluctuating trends with general upward trajectories, though the green line shows higher variability.
### Components/Axes
- **X-axis (Step)**: Labeled "Step," with markers at intervals of 20 (0, 20, 40, ..., 140).
- **Y-axis (critic/rewards/mean)**: Labeled "critic/rewards/mean," with values ranging from 0 to 0.2 in increments of 0.05.
- **Legend**: Positioned at the top-left corner, with two entries:
- Teal line: "qwen3_1.7b_grpo_only_old_policy"
- Green line: "qwen3_1.7b_dapo_baseline"
### Detailed Analysis
- **Teal Line (qwen3_1.7b_grpo_only_old_policy)**:
- Starts at ~0.05 at step 0.
- Gradually increases to ~0.15 by step 140.
- Exhibits moderate fluctuations (e.g., peaks at ~0.18 around step 100, troughs at ~0.12 around step 60).
- Slope: ~0.0005 per step (approximate linear fit).
- **Green Line (qwen3_1.7b_dapo_baseline)**:
- Starts at ~0.07 at step 0.
- Peaks at ~0.22 around step 100, then declines to ~0.15 by step 140.
- Highly volatile, with sharp spikes (e.g., ~0.25 at step 80) and troughs (e.g., ~0.10 at step 40).
- Slope: ~0.0007 per step (approximate linear fit).
### Key Observations
1. The green line ("dapo_baseline") begins higher than the teal line but shows greater instability, with larger deviations from its mean trajectory.
2. The teal line ("grpo_only_old_policy") demonstrates a steadier, more consistent upward trend.
3. Both lines converge near step 140, with the teal line closing at ~0.15 and the green line at ~0.14.
4. The green line’s volatility suggests higher sensitivity to external factors or policy changes compared to the teal line.
### Interpretation
The data suggests that the "grpo_only_old_policy" configuration (teal) achieves more stable and predictable performance improvements over time, while the "dapo_baseline" (green) exhibits higher variability, potentially due to less robust training dynamics or external noise. The convergence at step 140 implies that both policies may asymptotically approach similar performance levels, though the teal line’s stability could make it preferable for applications requiring reliability. The green line’s spikes might indicate moments of overfitting or reward hacking, warranting further investigation into its training process.