## Line Chart: Gemini-2.0-Flash
### Overview
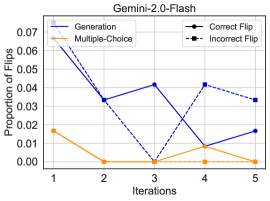
The image is a line chart titled "Gemini-2.0-Flash". It displays the proportion of flips across iterations for different categories: Generation, Multiple-Choice, Correct Flip, and Incorrect Flip. The x-axis represents iterations (1 to 5), and the y-axis represents the proportion of flips (0.00 to 0.07).
### Components/Axes
* **Title:** Gemini-2.0-Flash
* **X-axis:**
* Label: Iterations
* Scale: 1, 2, 3, 4, 5
* **Y-axis:**
* Label: Proportion of Flips
* Scale: 0.00, 0.01, 0.02, 0.03, 0.04, 0.05, 0.06, 0.07
* **Legend:** Located in the top-right corner.
* Generation (solid dark blue line)
* Multiple-Choice (solid orange line)
* Correct Flip (solid dark blue line with circle markers)
* Incorrect Flip (dashed dark blue line with square markers)
### Detailed Analysis
* **Generation:** The solid dark blue line starts at approximately 0.065 at iteration 1, decreases to approximately 0.033 at iteration 2, increases to approximately 0.042 at iteration 3, decreases to approximately 0.008 at iteration 4, and increases to approximately 0.017 at iteration 5.
* **Multiple-Choice:** The solid orange line starts at approximately 0.017 at iteration 1, decreases to approximately 0.000 at iteration 2, remains at approximately 0.000 at iteration 3, remains at approximately 0.000 at iteration 4, and remains at approximately 0.000 at iteration 5.
* **Correct Flip:** The solid dark blue line with circle markers starts at approximately 0.065 at iteration 1, decreases to approximately 0.033 at iteration 2, increases to approximately 0.042 at iteration 3, decreases to approximately 0.008 at iteration 4, and increases to approximately 0.017 at iteration 5.
* **Incorrect Flip:** The dashed dark blue line with square markers starts at approximately 0.065 at iteration 1, decreases to approximately 0.033 at iteration 2, increases to approximately 0.042 at iteration 3, increases to approximately 0.042 at iteration 4, and decreases to approximately 0.033 at iteration 5.
### Key Observations
* The proportion of flips for "Multiple-Choice" is consistently low across all iterations.
* The "Generation" and "Correct Flip" lines overlap completely.
* The "Incorrect Flip" line shows a more fluctuating pattern compared to "Multiple-Choice".
### Interpretation
The chart compares the proportion of flips across iterations for different methods or categories within the "Gemini-2.0-Flash" system. The "Multiple-Choice" category consistently has a very low proportion of flips, suggesting it is more stable or reliable. The overlapping "Generation" and "Correct Flip" lines indicate that these two categories have identical flip proportions across all iterations. The "Incorrect Flip" line's fluctuations suggest that the incorrect flips vary more significantly with each iteration. The data suggests that the "Multiple-Choice" method is significantly more stable than the other methods.