## Line Chart: Gemini-2.0-Flash Performance
### Overview
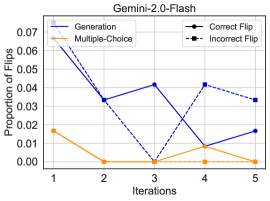
This image presents a line chart illustrating the "Proportion of Flips" across five "Iterations" for different model configurations: "Generation", "Multiple-Choice", "Correct Flip", and "Incorrect Flip". The chart appears to be evaluating the stability or consistency of the Gemini-2.0-Flash model.
### Components/Axes
* **Title:** Gemini-2.0-Flash (positioned at the top-center)
* **X-axis:** Iterations (labeled, ranging from 1 to 5, with tick marks at each integer value)
* **Y-axis:** Proportion of Flips (labeled, ranging from 0.00 to 0.07, with tick marks at 0.01 intervals)
* **Legend:** Located at the top-right corner, containing the following entries:
* Generation (solid blue line)
* Multiple-Choice (solid orange line)
* Correct Flip (dashed black line)
* Incorrect Flip (dashed dark-grey line)
* **Gridlines:** Horizontal and vertical gridlines are present to aid in reading values.
### Detailed Analysis
Let's analyze each data series:
* **Generation (solid blue line):** This line starts at approximately 0.063 at Iteration 1, decreases to around 0.032 at Iteration 2, rises to approximately 0.038 at Iteration 3, drops to about 0.008 at Iteration 4, and then increases to approximately 0.012 at Iteration 5. The overall trend is decreasing, but with some fluctuations.
* **Multiple-Choice (solid orange line):** This line begins at approximately 0.018 at Iteration 1, rapidly decreases to near 0.00 at Iteration 2, remains close to 0.00 for Iterations 3 and 4, and slightly increases to approximately 0.002 at Iteration 5. This line shows a strong decreasing trend.
* **Correct Flip (dashed black line):** This line starts at approximately 0.032 at Iteration 1, decreases to around 0.031 at Iteration 2, rises to approximately 0.038 at Iteration 3, increases to about 0.042 at Iteration 4, and then decreases to approximately 0.035 at Iteration 5. The trend is relatively flat with some minor fluctuations.
* **Incorrect Flip (dashed dark-grey line):** This line begins at approximately 0.035 at Iteration 1, decreases to around 0.031 at Iteration 2, drops to approximately 0.00 at Iteration 3, rises to about 0.037 at Iteration 4, and then decreases to approximately 0.032 at Iteration 5. This line shows a fluctuating trend, with a significant dip at Iteration 3.
### Key Observations
* The "Multiple-Choice" configuration exhibits the most significant decrease in "Proportion of Flips" across iterations, suggesting increased stability or consistency.
* The "Generation" configuration shows a more erratic pattern, with fluctuations in the proportion of flips.
* The "Incorrect Flip" line has a notable dip at Iteration 3, indicating a potential anomaly or change in behavior at that point.
* The "Correct Flip" line remains relatively stable throughout the iterations.
### Interpretation
The chart suggests that the Gemini-2.0-Flash model becomes more stable (fewer "flips" or changes in behavior) with each iteration, particularly when using the "Multiple-Choice" configuration. The "Generation" configuration, while also decreasing overall, exhibits more variability, potentially indicating a more complex or sensitive process. The dip in "Incorrect Flip" at Iteration 3 could be due to a specific optimization or adjustment made during that iteration, leading to a temporary reduction in incorrect flips. The "Correct Flip" line's stability suggests that the model is consistently identifying correct flips, which is a positive sign.
The "Proportion of Flips" metric likely represents the frequency of changes in the model's output or internal state. A lower proportion of flips indicates greater consistency and potentially better performance. The chart provides valuable insights into the model's behavior and the impact of different configurations on its stability. The data suggests that the model is learning and improving with each iteration, but further investigation may be needed to understand the cause of the fluctuations observed in the "Generation" and "Incorrect Flip" configurations.