## Line Chart: Gemini-2.0-Flash
### Overview
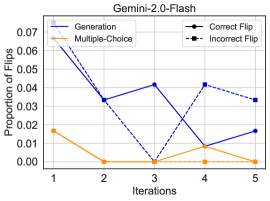
The chart visualizes the proportion of flips (correct and incorrect) across iterations for two methods: "Generation" (blue line) and "Multiple-Choice" (orange line). The y-axis represents the proportion of flips (0.00–0.07), and the x-axis represents iterations (1–5). The legend in the top-right corner distinguishes "Correct Flip" (solid black) and "Incorrect Flip" (dashed black), though these labels do not directly align with the line colors (blue/orange), suggesting potential ambiguity in the chart's design.
### Components/Axes
- **X-axis (Iterations)**: Labeled "Iterations" with discrete values 1, 2, 3, 4, 5.
- **Y-axis (Proportion of Flips)**: Labeled "Proportion of Flips" with a scale from 0.00 to 0.07 in increments of 0.01.
- **Legend**: Located in the top-right corner. Labels:
- "Correct Flip" (solid black circle)
- "Incorrect Flip" (dashed black square)
- **Lines**:
- **Blue Line (Generation)**: Solid squares as markers.
- **Orange Line (Multiple-Choice)**: Solid squares as markers.
### Detailed Analysis
1. **Generation (Blue Line)**:
- **Iteration 1**: ~0.07 (highest value).
- **Iteration 2**: ~0.03 (sharp decline).
- **Iteration 3**: ~0.04 (slight increase).
- **Iteration 4**: ~0.04 (stable).
- **Iteration 5**: ~0.03 (moderate decrease).
- **Trend**: Initial sharp decline followed by stabilization with minor fluctuations.
2. **Multiple-Choice (Orange Line)**:
- **Iteration 1**: ~0.01 (lowest value).
- **Iteration 2**: ~0.00 (near-zero).
- **Iteration 3**: ~0.00 (remains near-zero).
- **Iteration 4**: ~0.00 (remains near-zero).
- **Iteration 5**: ~0.00 (remains near-zero).
- **Trend**: Immediate and sustained near-zero proportion after iteration 1.
### Key Observations
- The "Generation" method starts with a high proportion of flips (~0.07) but decreases significantly by iteration 2, stabilizing around ~0.03–0.04 in later iterations.
- The "Multiple-Choice" method begins with a low proportion (~0.01) and drops to near-zero by iteration 2, remaining stable thereafter.
- The legend labels ("Correct Flip" and "Incorrect Flip") do not directly correspond to the line colors (blue/orange), creating potential confusion about what the lines represent.
### Interpretation
- **Data Implications**:
- The "Generation" method exhibits a higher initial proportion of flips that decreases over iterations, suggesting possible optimization or adaptation during the process.
- The "Multiple-Choice" method maintains a consistently low proportion of flips, indicating stability or effectiveness in minimizing flips from the start.
- **Ambiguity**: The mismatch between the legend labels ("Correct/Incorrect Flip") and the line labels ("Generation/Multiple-Choice") raises questions about whether the lines represent methods or flip types. If the lines represent methods, the legend might be mislabeled or incomplete.
- **Trend Significance**: The sharp decline in "Generation" flips after iteration 1 could reflect algorithmic adjustments, while the near-zero values for "Multiple-Choice" suggest a robust or static approach that avoids flips entirely after the first iteration.