## Line Chart: EGA vs Episode for Different Alpha Values
### Overview
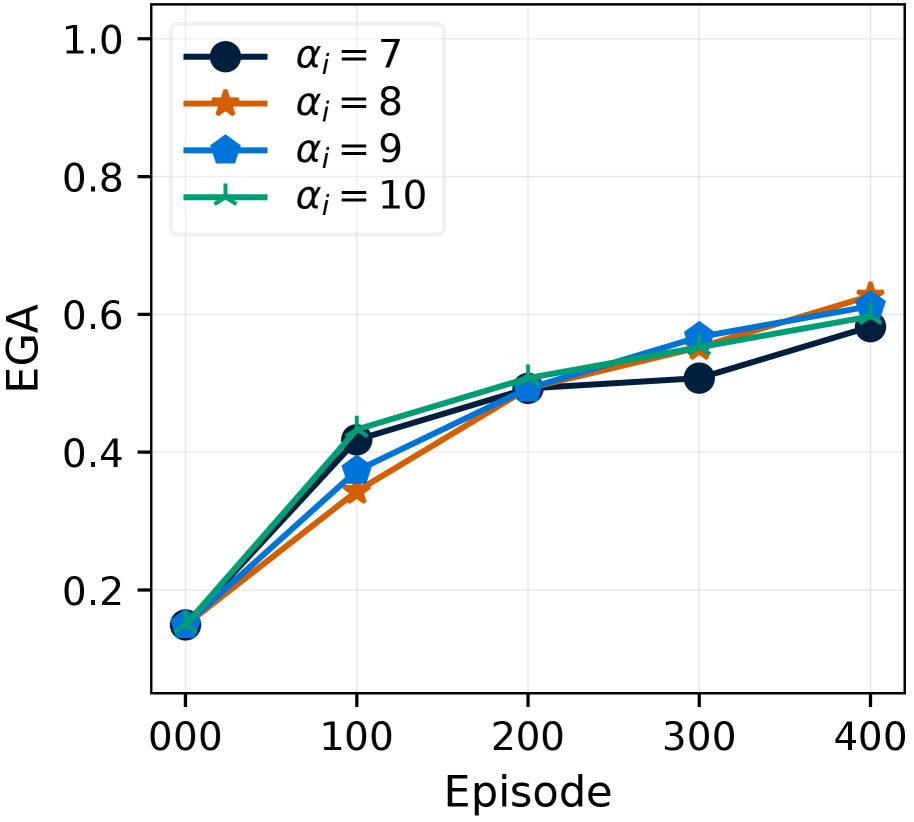
The image is a line chart showing the relationship between EGA (Estimated Generalization Ability) and Episode number for four different values of alpha (αᵢ = 7, 8, 9, 10). The chart displays how EGA changes over the course of episodes for each alpha value.
### Components/Axes
* **X-axis (Horizontal):** Episode, with markers at 000, 100, 200, 300, and 400.
* **Y-axis (Vertical):** EGA, ranging from 0.0 to 1.0, with markers at 0.2, 0.4, 0.6, 0.8, and 1.0.
* **Legend (Top-Left):**
* Dark Blue (circle marker): αᵢ = 7
* Orange (star marker): αᵢ = 8
* Blue (pentagon marker): αᵢ = 9
* Teal (plus marker): αᵢ = 10
### Detailed Analysis
* **αᵢ = 7 (Dark Blue, circle marker):**
* Trend: Generally increasing.
* Data Points:
* Episode 000: EGA ≈ 0.15
* Episode 100: EGA ≈ 0.42
* Episode 200: EGA ≈ 0.50
* Episode 300: EGA ≈ 0.51
* Episode 400: EGA ≈ 0.58
* **αᵢ = 8 (Orange, star marker):**
* Trend: Generally increasing.
* Data Points:
* Episode 000: EGA ≈ 0.15
* Episode 100: EGA ≈ 0.35
* Episode 200: EGA ≈ 0.49
* Episode 300: EGA ≈ 0.56
* Episode 400: EGA ≈ 0.62
* **αᵢ = 9 (Blue, pentagon marker):**
* Trend: Generally increasing.
* Data Points:
* Episode 000: EGA ≈ 0.15
* Episode 100: EGA ≈ 0.38
* Episode 200: EGA ≈ 0.50
* Episode 300: EGA ≈ 0.57
* Episode 400: EGA ≈ 0.60
* **αᵢ = 10 (Teal, plus marker):**
* Trend: Generally increasing.
* Data Points:
* Episode 000: EGA ≈ 0.15
* Episode 100: EGA ≈ 0.42
* Episode 200: EGA ≈ 0.50
* Episode 300: EGA ≈ 0.55
* Episode 400: EGA ≈ 0.61
### Key Observations
* All lines start at approximately the same EGA value (0.15) at Episode 000.
* The EGA values for all alpha values increase as the number of episodes increases.
* The lines converge towards the end of the episode range (300-400).
* αᵢ = 8 shows the highest EGA value at Episode 400.
* αᵢ = 7 shows the lowest EGA value at Episode 400.
### Interpretation
The chart suggests that increasing the alpha value initially leads to a faster increase in EGA, as seen in the early episodes. However, as the number of episodes increases, the differences in EGA between the different alpha values become smaller, and the lines converge. This indicates that the choice of alpha value has a more significant impact on the initial learning phase, but its influence diminishes as the agent learns over more episodes. The fact that αᵢ = 8 achieves the highest EGA at the end suggests that there might be an optimal alpha value for maximizing generalization ability in this particular scenario. The convergence of the lines also implies that with enough training episodes, the agent's performance becomes less sensitive to the initial alpha value.