\n
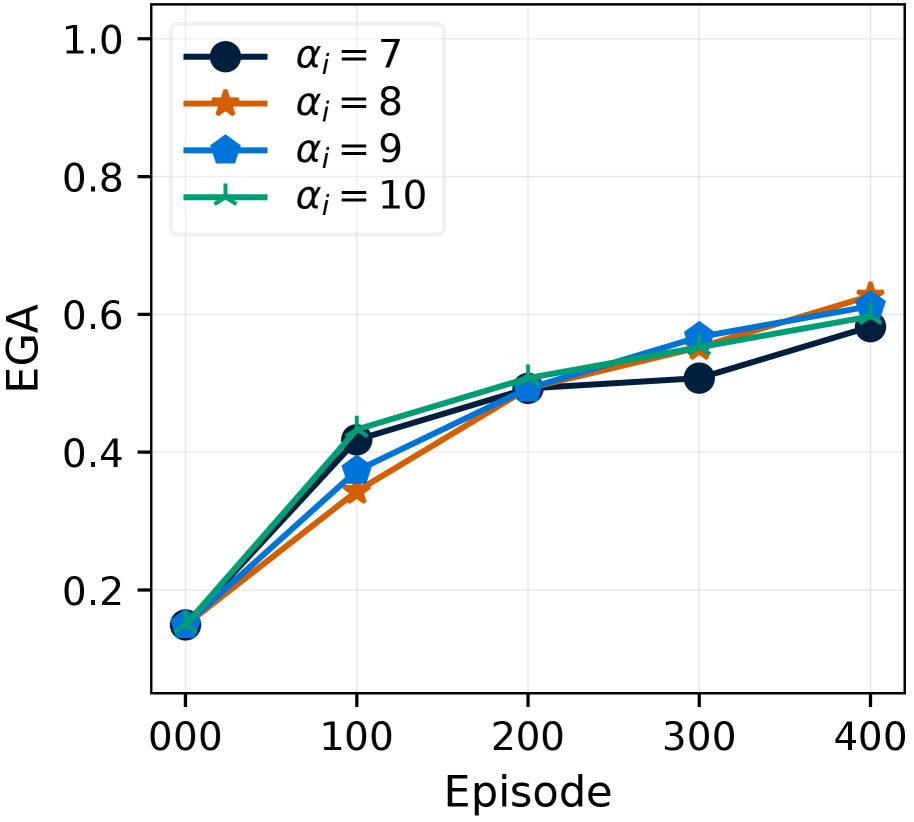
## Line Chart: EGA vs. Episode for Different Alpha Values
### Overview
This image presents a line chart illustrating the relationship between Episode number and EGA (presumably a performance metric) for four different values of α (alpha). The chart displays how EGA changes over the course of 400 episodes for each alpha value.
### Components/Axes
* **X-axis:** Episode, ranging from 0 to 400, with markers at 0, 100, 200, 300, and 400.
* **Y-axis:** EGA, ranging from 0 to 1.0, with markers at 0.2, 0.4, 0.6, 0.8, and 1.0.
* **Legend:** Located in the top-left corner, identifying four data series:
* αᵢ = 7 (Black circle)
* αᵢ = 8 (Orange triangle)
* αᵢ = 9 (Light blue diamond)
* αᵢ = 10 (Teal triangle)
* **Grid:** A light gray grid is present in the background to aid in reading values.
### Detailed Analysis
Here's a breakdown of the data series, observing trends and extracting approximate values:
* **αᵢ = 7 (Black):** The line starts at approximately 0.18 at Episode 0, rises to around 0.45 at Episode 100, plateaus around 0.52-0.53 between Episodes 100 and 300, and then increases slightly to approximately 0.58 at Episode 400.
* **αᵢ = 8 (Orange):** The line begins at approximately 0.16 at Episode 0, increases to around 0.43 at Episode 100, reaches a peak of approximately 0.54 at Episode 200, and then fluctuates around 0.54-0.56 between Episodes 200 and 400, ending at approximately 0.61 at Episode 400.
* **αᵢ = 9 (Light Blue):** The line starts at approximately 0.17 at Episode 0, rises to around 0.44 at Episode 100, reaches approximately 0.53 at Episode 200, and then increases to approximately 0.58 at Episode 300, ending at approximately 0.60 at Episode 400.
* **αᵢ = 10 (Teal):** The line begins at approximately 0.15 at Episode 0, increases to around 0.42 at Episode 100, reaches approximately 0.51 at Episode 200, and then increases to approximately 0.57 at Episode 300, ending at approximately 0.62 at Episode 400.
### Key Observations
* All four lines exhibit an upward trend, indicating that EGA generally increases with the number of episodes for all alpha values.
* The lines converge as the episode number increases, suggesting that the impact of alpha diminishes over time.
* αᵢ = 10 consistently shows the highest EGA values, particularly in the later episodes.
* αᵢ = 7 consistently shows the lowest EGA values, particularly in the later episodes.
* The most significant increase in EGA for all lines occurs between Episodes 0 and 100.
### Interpretation
The data suggests that the parameter α has a positive influence on the EGA metric, with higher values of α leading to better performance (higher EGA). However, the effect of α appears to diminish as the number of episodes increases, indicating that the system converges towards a similar performance level regardless of the initial α value. The initial rapid increase in EGA for all alpha values suggests a period of rapid learning or adaptation at the beginning of the process. The convergence of the lines implies that the system eventually reaches a stable state where the initial α value has less impact on the overall performance. The differences in final EGA values between the alpha values suggest that while the system converges, the initial choice of alpha can still influence the final performance level. This could be due to the exploration-exploitation trade-off inherent in reinforcement learning or other optimization processes.