## Line Graph: EGA Performance Across Episodes for Different Alpha Values
### Overview
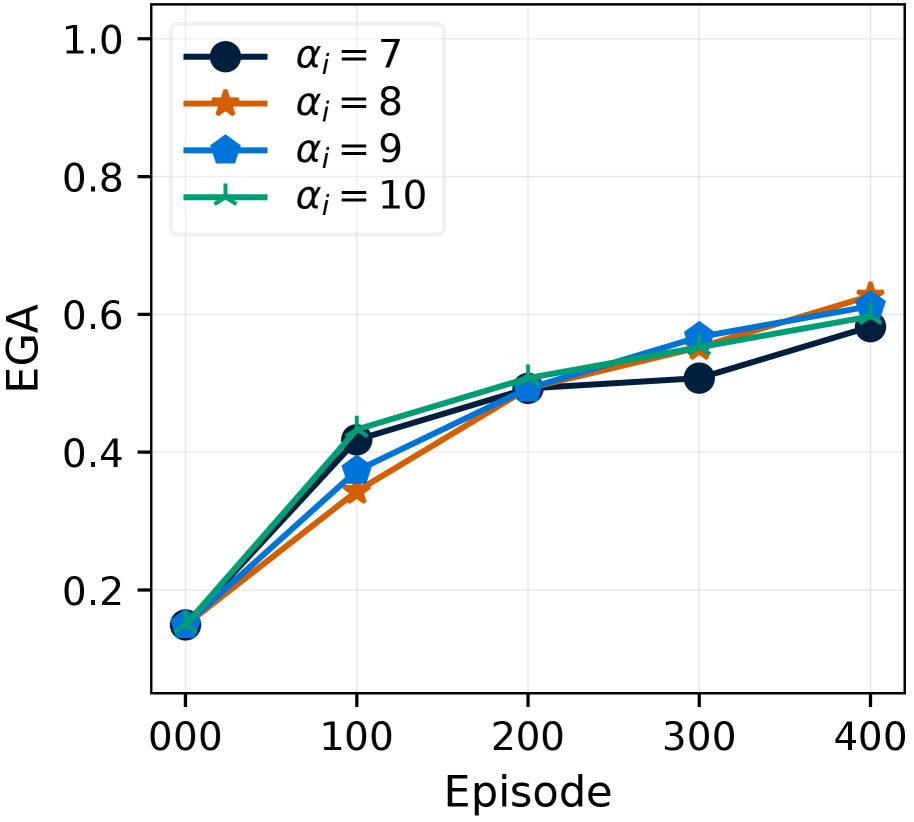
The graph illustrates the evolution of Expected Goal Accuracy (EGA) over training episodes for four distinct alpha (α) values (7, 8, 9, 10). All lines originate near 0.15 EGA at episode 0 and exhibit upward trends, with varying rates of improvement and final performance levels.
### Components/Axes
- **X-axis**: "Episode" (0 to 400), with ticks at 0, 100, 200, 300, 400.
- **Y-axis**: "EGA" (0.0 to 1.0), with ticks at 0.0, 0.2, 0.4, 0.6, 0.8, 1.0.
- **Legend**: Located in the top-left corner, mapping:
- **α = 7**: Black circles (●)
- **α = 8**: Orange stars (★)
- **α = 9**: Blue diamonds (◆)
- **α = 10**: Green crosses (✖️)
### Detailed Analysis
1. **α = 7 (Black Circles)**:
- Starts at ~0.15 EGA (episode 0).
- Increases steadily to ~0.42 (episode 100), ~0.50 (200), ~0.52 (300), and ~0.58 (400).
- Smooth, linear growth with minimal fluctuation.
2. **α = 8 (Orange Stars)**:
- Begins at ~0.15 EGA (episode 0).
- Dips slightly to ~0.35 (episode 100), then rises to ~0.55 (200), ~0.57 (300), and ~0.63 (400).
- Exhibits a "V" shape with a mid-episode dip before accelerating.
3. **α = 9 (Blue Diamonds)**:
- Starts at ~0.15 EGA (episode 0).
- Rises sharply to ~0.38 (100), ~0.52 (200), ~0.59 (300), and ~0.62 (400).
- Steeper slope than α = 7, with consistent upward momentum.
4. **α = 10 (Green Crosses)**:
- Begins at ~0.15 EGA (episode 0).
- Peaks at ~0.45 (100), dips to ~0.50 (200), then rises to ~0.58 (300) and ~0.61 (400).
- Shows a plateau phase between episodes 100–200 before resuming growth.
### Key Observations
- **Convergence at Later Episodes**: All lines approach similar EGA values (~0.58–0.63) by episode 400, suggesting diminishing returns for higher α values.
- **α = 8 vs. α = 9**: α = 8 outperforms α = 9 in final EGA (0.63 vs. 0.62), despite α = 9’s faster initial growth.
- **α = 10’s Volatility**: α = 10 exhibits the most fluctuation, with a mid-graph plateau that delays its final improvement.
- **α = 7’s Consistency**: α = 7 demonstrates the most stable, linear progression without dips or plateaus.
### Interpretation
The data suggests that higher α values generally improve EGA, but with trade-offs:
- **Optimal α**: α = 8 achieves the highest final EGA (0.63) while maintaining moderate growth stability.
- **Rapid Learners**: α = 9 excels in early episodes but plateaus slightly earlier than α = 8.
- **High α Risks**: α = 10’s volatility and delayed improvement indicate potential overfitting or sensitivity to hyperparameters.
- **Baseline Performance**: α = 7 provides reliable, steady progress, making it a safe choice for consistent training.
The graph highlights the balance between exploration (higher α) and exploitation (lower α) in optimization tasks, with α = 8 emerging as the most efficient compromise in this scenario.