## Line Chart and Scatter Plot: Model Performance vs. Parameters and Generalization
### Overview
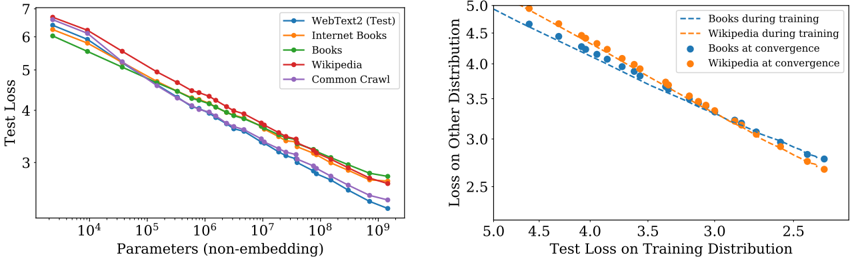
The image contains two charts analyzing model performance. The left chart shows test loss trends across datasets as parameters increase. The right chart compares training loss on specific distributions with generalization performance.
### Components/Axes
**Left Chart (Line Chart):**
- **X-axis**: "Parameters (non-embedding)" (log scale: 10⁴ to 10⁹)
- **Y-axis**: "Test Loss" (linear scale: 2.5 to 7)
- **Legend**:
- WebText2 (Test) – Blue
- Internet Books – Orange
- Books – Green
- Wikipedia – Red
- Common Crawl – Purple
**Right Chart (Scatter Plot):**
- **X-axis**: "Test Loss on Training Distribution" (linear scale: 2.5 to 5.0)
- **Y-axis**: "Loss on Other Distribution" (linear scale: 2.5 to 5.0)
- **Legend**:
- Books during training – Dashed Blue
- Wikipedia during training – Dashed Orange
- Books at convergence – Solid Blue
- Wikipedia at convergence – Solid Orange
### Detailed Analysis
**Left Chart Trends:**
- All lines descend as parameters increase, confirming that larger models generally improve test performance.
- **WebText2 (Test)** starts highest (~6.5 at 10⁴ parameters) and ends lowest (~2.5 at 10⁹).
- **Common Crawl** starts lowest (~6.0 at 10⁴) and ends slightly higher (~2.0 at 10⁹).
- Lines diverge slightly at mid-range parameters (10⁶–10⁷), with WebText2 and Wikipedia maintaining the largest gap.
**Right Chart Trends:**
- Dashed lines (training loss) show a strong negative correlation: lower training loss correlates with lower loss on other distributions.
- Solid points (convergence) for Books and Wikipedia are consistently below their respective dashed lines, indicating better generalization when training loss is minimized.
- Books at convergence (solid blue) and Wikipedia at convergence (solid orange) cluster tightly near (2.5, 2.5), suggesting optimal generalization.
### Key Observations
1. **Parameter Efficiency**: WebText2 and Wikipedia datasets show the steepest improvement with parameter growth, while Common Crawl plateaus earlier.
2. **Generalization Gap**: Models trained on Books and Wikipedia achieve significantly lower loss on other distributions at convergence compared to their training performance.
3. **Dataset-Specific Behavior**: WebText2 (Test) and Common Crawl exhibit less pronounced parameter-driven improvements, possibly due to dataset complexity or noise.
### Interpretation
The left chart demonstrates that increasing model size reduces test loss across datasets, with WebText2 and Wikipedia benefiting most. The right chart reveals that minimizing training loss on Books and Wikipedia leads to superior generalization, as evidenced by the convergence points. This suggests that dataset choice and training efficiency (achieving low training loss) are critical for building models that generalize well. The divergence in parameter efficiency highlights dataset-specific challenges, such as WebText2's complexity requiring more parameters for comparable gains.