## Pie Charts: Error Distributions Across AI Models (Search and Read w/ Demo)
### Overview
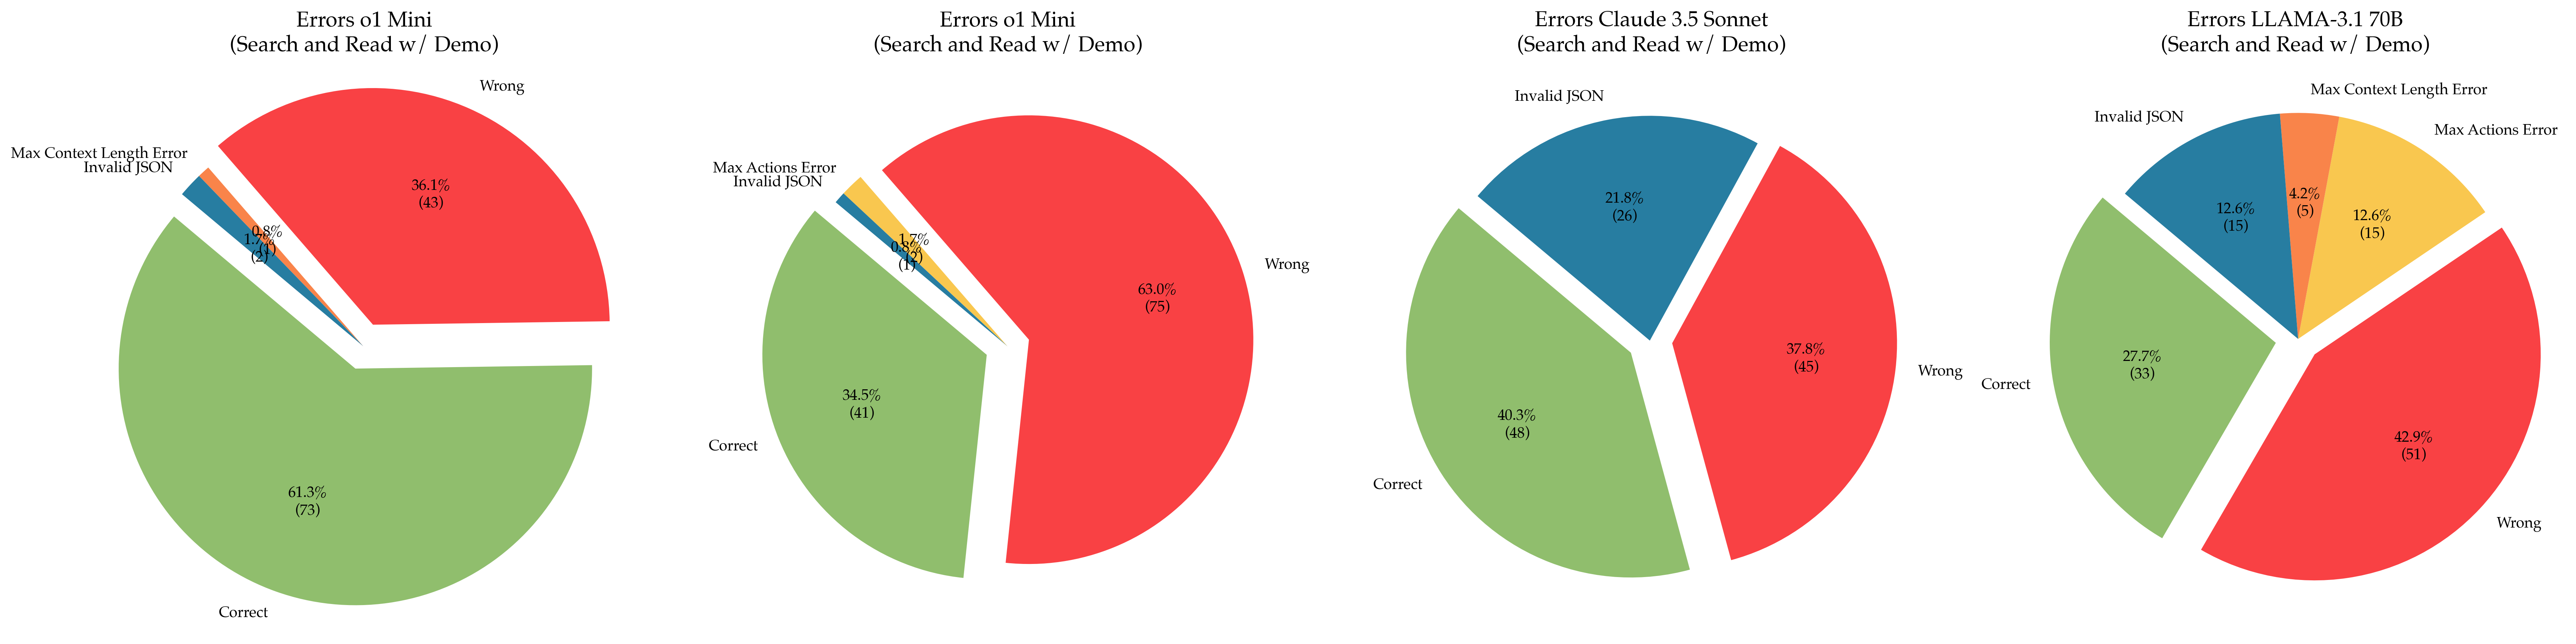
The image contains four pie charts comparing error distributions across four AI models:
1. Errors o1 Mini
2. Errors o1 Mini (duplicate title, likely a variant)
3. Errors Claude 3.5 Sonnet
4. Errors LLaMA-3.1 70B
Each chart categorizes results into "Correct," "Wrong," "Invalid JSON," and smaller error subtypes (e.g., "Max Context Length Error," "Max Actions Error"). Percentages and counts are provided for each category.
---
### Components/Axes
- **Titles**: Explicitly state the model and context (e.g., "Errors o1 Mini (Search and Read w / Demo)").
- **Categories**:
- **Primary**: "Correct," "Wrong," "Invalid JSON."
- **Secondary**: Sub-errors like "Max Context Length Error" and "Max Actions Error" (only in some charts).
- **Colors**:
- Green = "Correct"
- Red = "Wrong"
- Blue = "Invalid JSON"
- Yellow/Orange = Secondary errors (varies by chart).
- **Legends**: Implied via color coding; no explicit legend box is visible.
---
### Detailed Analysis
#### Chart 1: Errors o1 Mini
- **Correct**: 61.3% (73)
- **Wrong**: 36.1% (43)
- **Invalid JSON**: 2.6% (3)
- **Max Context Length Error**: 0.8% (1)
- **Max Actions Error**: 0.2% (0.5)
#### Chart 2: Errors o1 Mini (Variant)
- **Correct**: 34.5% (41)
- **Wrong**: 63.0% (75)
- **Invalid JSON**: 1.7% (1)
- **Max Actions Error**: 0.7% (1)
#### Chart 3: Errors Claude 3.5 Sonnet
- **Correct**: 40.3% (48)
- **Wrong**: 37.8% (45)
- **Invalid JSON**: 21.8% (26)
#### Chart 4: Errors LLaMA-3.1 70B
- **Correct**: 27.7% (33)
- **Wrong**: 42.9% (51)
- **Invalid JSON**: 12.6% (15)
- **Max Actions Error**: 12.6% (15)
- **Max Context Length Error**: 4.2% (5)
---
### Key Observations
1. **Dominant Categories**:
- "Correct" and "Wrong" dominate all charts, with "Invalid JSON" varying significantly.
- LLaMA-3.1 70B has the highest "Wrong" (42.9%) and "Max Actions Error" (12.6%).
- Claude 3.5 Sonnet has the highest "Invalid JSON" (21.8%).
2. **Secondary Errors**:
- "Max Context Length Error" and "Max Actions Error" are minor but present in some models.
- LLaMA-3.1 70B has the most diverse error distribution, including both secondary errors.
3. **Model Performance**:
- o1 Mini (first chart) has the highest "Correct" rate (61.3%).
- o1 Mini (second chart) has the lowest "Correct" rate (34.5%) and highest "Wrong" (63.0%).
---
### Interpretation
- **Model Reliability**:
- Models with higher "Correct" percentages (e.g., o1 Mini) perform better in search and read tasks.
- High "Wrong" rates (e.g., o1 Mini variant) suggest frequent logical or factual errors.
- **Input Sensitivity**:
- "Invalid JSON" errors (e.g., Claude 3.5 Sonnet) indicate issues with input formatting or schema validation.
- **Edge Cases**:
- Secondary errors like "Max Context Length" and "Max Actions" may reflect limitations in handling long inputs or complex workflows.
- **Anomalies**:
- The duplicate "Errors o1 Mini" charts suggest a possible data duplication or variant testing scenario.
- LLaMA-3.1 70B’s high "Wrong" and secondary errors highlight potential trade-offs between scale and precision.
---
### Spatial Grounding & Color Verification
- All charts follow a consistent color scheme:
- Green = "Correct" (confirmed across all charts).
- Red = "Wrong" (confirmed across all charts).
- Blue = "Invalid JSON" (confirmed in Charts 1, 3, 4).
- Secondary errors use distinct colors (yellow/orange) but lack a unified legend.
---
### Conclusion
The data reveals trade-offs between model performance, input sensitivity, and error types. While o1 Mini variants show mixed results, Claude 3.5 Sonnet and LLaMA-3.1 70B exhibit distinct error profiles, suggesting differences in architecture or training data handling. Further analysis of input validation and error mitigation strategies is warranted.