## Bar Chart: Model Performance on Various Subjects
### Overview
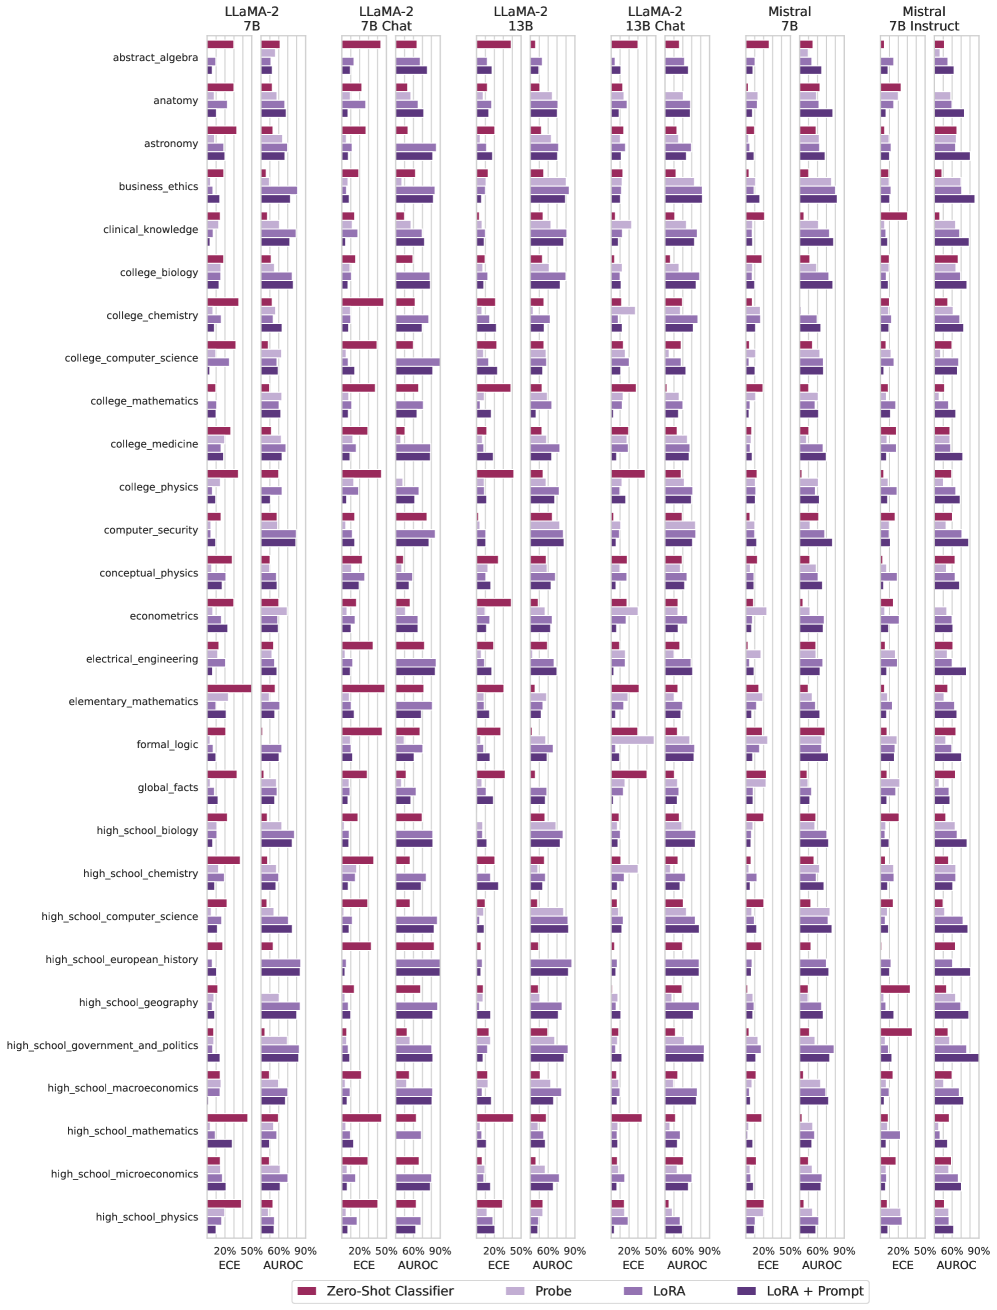
The image is a series of bar charts comparing the performance of different language models (LLaMA-2 7B, LLaMA-2 7B Chat, LLaMA-2 13B, LLaMA-2 13B Chat, Mistral 7B, Mistral 7B Instruct) across a range of subjects. Performance is measured using ECE (Expected Calibration Error) and AUROC (Area Under the Receiver Operating Characteristic curve) metrics, with different training/prompting strategies (Zero-Shot Classifier, Probe, LoRA, LoRA + Prompt).
### Components/Axes
* **X-axis:** Performance metrics (ECE and AUROC) ranging from 20% to 90%. Axis markers are present at 20%, 50%, 60%, and 90%.
* **Y-axis:** Subjects, including abstract algebra, anatomy, astronomy, business ethics, clinical knowledge, college biology, college chemistry, college computer science, college mathematics, college medicine, college physics, computer security, conceptual physics, econometrics, electrical engineering, elementary mathematics, formal logic, global facts, high school biology, high school chemistry, high school computer science, high school european history, high school geography, high school government and politics, high school macroeconomics, high school mathematics, high school microeconomics, and high school physics.
* **Chart Titles (Top):** LLaMA-2 7B, LLaMA-2 7B Chat, LLaMA-2 13B, LLaMA-2 13B Chat, Mistral 7B, Mistral 7B Instruct. These indicate the specific language model being evaluated in each chart.
* **Legend (Bottom):**
* Zero-Shot Classifier (Dark Red)
* Probe (Light Purple)
* LoRA (Medium Purple)
* LoRA + Prompt (Dark Purple)
### Detailed Analysis
Each subject has four bars representing the four different training/prompting strategies. The length of each bar corresponds to the performance metric (ECE or AUROC).
Here's a breakdown of the performance for a few selected subjects, noting the trends:
* **Abstract Algebra:**
* LLaMA-2 7B: Zero-Shot Classifier ~20%, Probe ~30%, LoRA ~35%, LoRA + Prompt ~40%
* LLaMA-2 7B Chat: Zero-Shot Classifier ~20%, Probe ~30%, LoRA ~35%, LoRA + Prompt ~40%
* LLaMA-2 13B: Zero-Shot Classifier ~20%, Probe ~35%, LoRA ~40%, LoRA + Prompt ~45%
* LLaMA-2 13B Chat: Zero-Shot Classifier ~20%, Probe ~35%, LoRA ~40%, LoRA + Prompt ~45%
* Mistral 7B: Zero-Shot Classifier ~20%, Probe ~30%, LoRA ~35%, LoRA + Prompt ~40%
* Mistral 7B Instruct: Zero-Shot Classifier ~20%, Probe ~30%, LoRA ~35%, LoRA + Prompt ~40%
* **Anatomy:**
* LLaMA-2 7B: Zero-Shot Classifier ~20%, Probe ~30%, LoRA ~35%, LoRA + Prompt ~40%
* LLaMA-2 7B Chat: Zero-Shot Classifier ~20%, Probe ~30%, LoRA ~35%, LoRA + Prompt ~40%
* LLaMA-2 13B: Zero-Shot Classifier ~20%, Probe ~35%, LoRA ~40%, LoRA + Prompt ~45%
* LLaMA-2 13B Chat: Zero-Shot Classifier ~20%, Probe ~35%, LoRA ~40%, LoRA + Prompt ~45%
* Mistral 7B: Zero-Shot Classifier ~20%, Probe ~30%, LoRA ~35%, LoRA + Prompt ~40%
* Mistral 7B Instruct: Zero-Shot Classifier ~20%, Probe ~30%, LoRA ~35%, LoRA + Prompt ~40%
* **Electrical Engineering:**
* LLaMA-2 7B: Zero-Shot Classifier ~85%, Probe ~30%, LoRA ~35%, LoRA + Prompt ~40%
* LLaMA-2 7B Chat: Zero-Shot Classifier ~85%, Probe ~30%, LoRA ~35%, LoRA + Prompt ~40%
* LLaMA-2 13B: Zero-Shot Classifier ~85%, Probe ~35%, LoRA ~40%, LoRA + Prompt ~45%
* LLaMA-2 13B Chat: Zero-Shot Classifier ~85%, Probe ~35%, LoRA ~40%, LoRA + Prompt ~45%
* Mistral 7B: Zero-Shot Classifier ~85%, Probe ~30%, LoRA ~35%, LoRA + Prompt ~40%
* Mistral 7B Instruct: Zero-Shot Classifier ~85%, Probe ~30%, LoRA ~35%, LoRA + Prompt ~40%
### Key Observations
* **Zero-Shot Classifier Performance:** The Zero-Shot Classifier (dark red) often shows the highest performance in electrical engineering, but the lowest in other subjects.
* **LoRA + Prompt Improvement:** LoRA + Prompt (dark purple) generally improves performance compared to Probe (light purple) and LoRA (medium purple) alone.
* **Model Variation:** The LLaMA-2 13B and LLaMA-2 13B Chat models tend to perform slightly better than the 7B models across most subjects.
* **Subject Sensitivity:** Performance varies significantly across subjects, indicating that some subjects are inherently easier or more aligned with the models' training data.
### Interpretation
The data suggests that fine-tuning language models with LoRA and providing prompts can improve their performance on various subjects. The Zero-Shot Classifier performs well in some areas, but struggles in others, highlighting the importance of task-specific training. The differences between the 7B and 13B models indicate that model size can also impact performance. The variation across subjects suggests that the models have different levels of knowledge or proficiency in different domains. The "Chat" versions of the models do not show a significant performance difference compared to their base counterparts.