TECHNICAL ASSET FINGERPRINT
ef52c792110e5a2251af06cf
Click to view fullscreen
Press ESC or click to close
FOUND IN PAPERS
EXPERT: healer-alpha-free VERSION 1
RUNTIME: free/openrouter/healer-alpha
INTEL_VERIFIED
## Scatter Plot Comparison: OlymMATH Benchmark Performance (EN vs. ZH)
### Overview
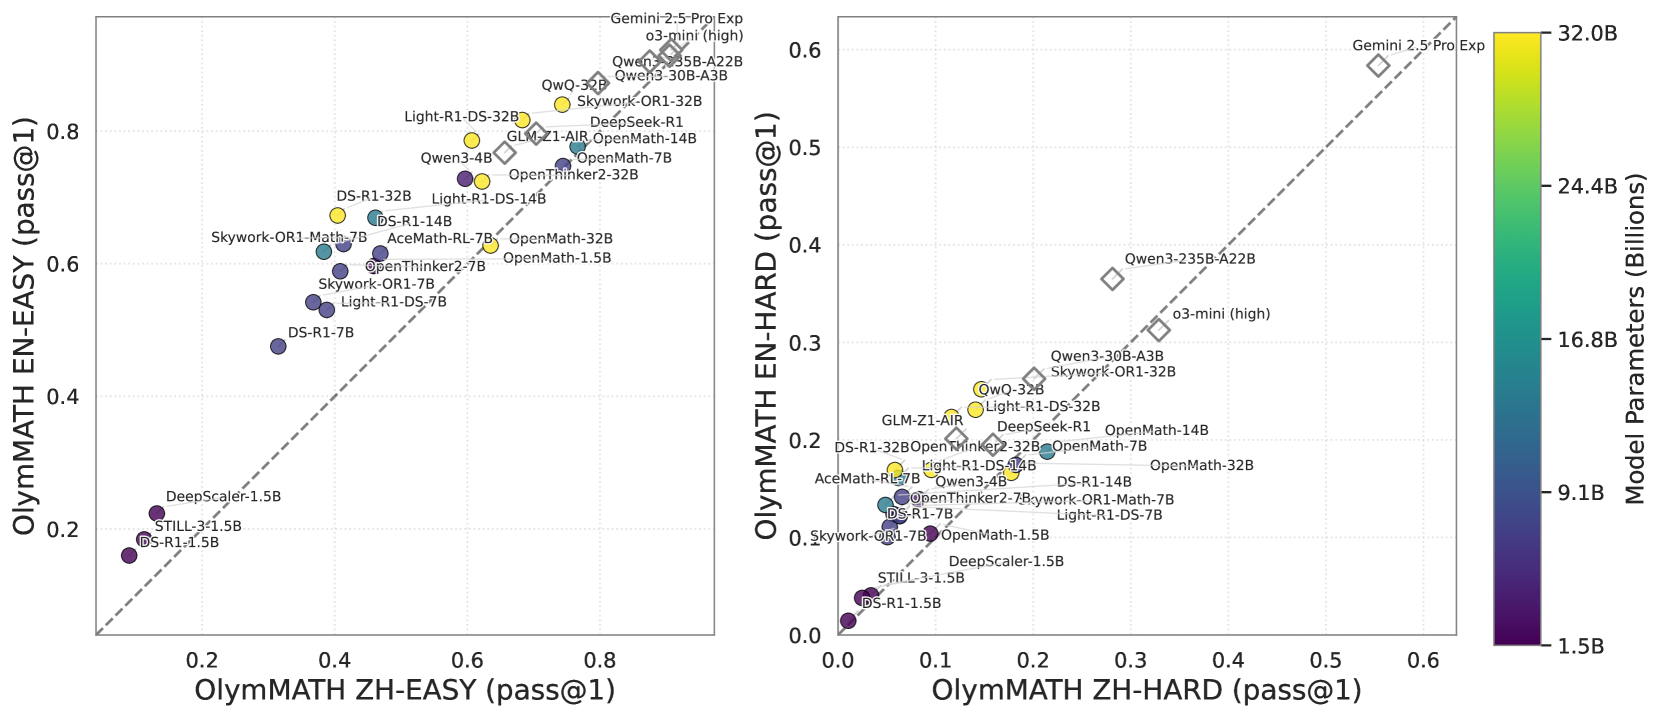
The image displays two side-by-side scatter plots comparing the performance of various large language models (LLMs) on the "OlymMATH" benchmark. The left plot compares performance on "EASY" problems, while the right plot compares performance on "HARD" problems. Each data point represents a specific model, plotted according to its score on the Chinese (ZH) version versus the English (EN) version of the benchmark. The color of each point indicates the model's approximate parameter count in billions.
### Components/Axes
**Common Elements:**
* **Color Bar (Far Right):** A vertical color scale labeled "Model Parameters (Billions)". It ranges from dark purple (1.5B) at the bottom to bright yellow (32.0B) at the top, with intermediate markers at 9.1B, 16.8B, and 24.4B.
* **Diagonal Dashed Line:** A gray dashed line (y = x) runs through both plots, representing equal performance on the Chinese and English versions.
**Left Plot: OlymMATH EASY**
* **X-Axis:** "OlymMATH ZH-EASY (pass@1)". Scale ranges from 0.0 to 0.8.
* **Y-Axis:** "OlymMATH EN-EASY (pass@1)". Scale ranges from 0.0 to 0.8.
* **Data Points:** Approximately 25-30 labeled circles, colored according to the parameter scale.
**Right Plot: OlymMATH HARD**
* **X-Axis:** "OlymMATH ZH-HARD (pass@1)". Scale ranges from 0.0 to 0.6.
* **Y-Axis:** "OlymMATH EN-HARD (pass@1)". Scale ranges from 0.0 to 0.6.
* **Data Points:** Approximately 25-30 labeled circles, colored according to the parameter scale.
### Detailed Analysis
**Left Plot (EASY Problems) - Data Points & Trends:**
* **Trend:** There is a strong positive correlation between performance on ZH-EASY and EN-EASY. Most models lie close to or slightly above the diagonal line, suggesting comparable or slightly better performance in English on easy problems.
* **Top Performers (High EN & ZH scores):**
* `Gemini-2.5-Pro Exp` (Yellow, ~32B): ~0.85 ZH, ~0.88 EN.
* `o3-mini (high)` (Yellow, ~32B): ~0.82 ZH, ~0.86 EN.
* `Qwen3-235B-A22B` (Yellow, ~32B): ~0.80 ZH, ~0.85 EN.
* `Qwen3-30B-A3B` (Yellow, ~32B): ~0.78 ZH, ~0.83 EN.
* `Skywork-OR1-32B` (Yellow, ~32B): ~0.75 ZH, ~0.82 EN.
* **Mid-Range Cluster:** A dense cluster of models with scores between 0.4 and 0.7 on both axes. Includes models like `Light-R1-DS-32B`, `DeepSeek-R1`, `GLM-Z1-AIR`, `OpenMath-14B`, `Qwen3-4B`, `OpenThinker2-32B`, `OpenMath-7B`, `DS-R1-32B`, `Light-R1-DS-14B`, `DS-R1-14B`, `Skywork-OR1-Math-7B`, `AceMath-RL-7B`, `OpenMath-32B`, `OpenMath-1.5B`, `OpenThinker2-7B`, `Skywork-OR1-7B`, `Light-R1-DS-7B`.
* **Lower Performers (Low EN & ZH scores):**
* `DS-R1-7B` (Purple, ~9.1B): ~0.35 ZH, ~0.48 EN.
* `DeepScaler-1.5B` (Dark Purple, ~1.5B): ~0.15 ZH, ~0.22 EN.
* `STILL-3-1.5B` (Dark Purple, ~1.5B): ~0.10 ZH, ~0.18 EN.
* `DS-R1-1.5B` (Dark Purple, ~1.5B): ~0.08 ZH, ~0.16 EN.
**Right Plot (HARD Problems) - Data Points & Trends:**
* **Trend:** A positive correlation exists, but with more scatter. Many models fall below the diagonal line, indicating a tendency for higher scores on ZH-HARD compared to EN-HARD for the same model.
* **Top Performer:**
* `Gemini-2.5-Pro Exp` (Yellow, ~32B): ~0.55 ZH, ~0.58 EN. It is a clear outlier, far above the rest.
* **High-End Cluster:**
* `Qwen3-235B-A22B` (Yellow, ~32B): ~0.28 ZH, ~0.37 EN.
* `o3-mini (high)` (Yellow, ~32B): ~0.33 ZH, ~0.32 EN.
* `Qwen3-30B-A3B` (Yellow, ~32B): ~0.25 ZH, ~0.27 EN.
* `Skywork-OR1-32B` (Yellow, ~32B): ~0.22 ZH, ~0.25 EN.
* **Mid-Range Cluster:** A dense group with scores between 0.05 and 0.20 on both axes. Includes `QwQ-32B`, `Light-R1-DS-32B`, `GLM-Z1-AIR`, `DeepSeek-R1`, `OpenMath-14B`, `OpenThinker2-32B`, `OpenMath-7B`, `OpenMath-32B`, `DS-R1-32B`, `Light-R1-DS-14B`, `DS-R1-14B`, `AceMath-RL-7B`, `Skywork-OR1-Math-7B`, `Light-R1-DS-7B`, `OpenMath-1.5B`, `Skywork-OR1-7B`.
* **Lower Performers:**
* `DeepScaler-1.5B` (Dark Purple, ~1.5B): ~0.08 ZH, ~0.05 EN.
* `STILL-3-1.5B` (Dark Purple, ~1.5B): ~0.04 ZH, ~0.03 EN.
* `DS-R1-1.5B` (Dark Purple, ~1.5B): ~0.02 ZH, ~0.01 EN.
### Key Observations
1. **Parameter Size Correlation:** Larger models (yellow, ~32B) consistently occupy the top-right (high performance) regions of both plots. Smaller models (dark purple, ~1.5B) are clustered in the bottom-left. This demonstrates a clear positive correlation between model size and benchmark performance.
2. **Language Performance Gap:** On EASY problems, models perform similarly or slightly better in English. On HARD problems, there is a noticeable shift where many models achieve higher scores in Chinese (points below the diagonal), suggesting the HARD Chinese benchmark may be relatively easier for these models than the HARD English version.
3. **Outlier:** `Gemini-2.5-Pro Exp` is the dominant model on both benchmarks, especially on the HARD set where it is in a league of its own.
4. **Model Families:** Models from the same family (e.g., `Qwen3-*`, `OpenMath-*`, `DS-R1-*`, `Skywork-OR1-*`) tend to cluster together, with performance scaling with their parameter count variant.
### Interpretation
This visualization provides a comparative snapshot of LLM capabilities on mathematical reasoning across languages and difficulty levels. The data suggests that:
* **Scale is a primary driver of performance:** Increasing parameter count is strongly associated with higher pass@1 rates on this benchmark.
* **Language parity is not uniform:** The relative ease of a problem set is language-dependent. The "HARD" Chinese problems appear more solvable for these models than their English counterparts, which could indicate differences in problem style, cultural context, or the training data composition of the models.
* **Benchmarking Utility:** The OlymMATH benchmark effectively stratifies models by capability. The clear separation between model tiers (e.g., 1.5B vs. 32B) and the identification of a standout performer (`Gemini-2.5-Pro Exp`) make it a useful tool for evaluating progress in mathematical reasoning.
* **Investigative Insight:** The shift in the performance gap between languages from EASY to HARD problems warrants further investigation. It could reveal biases in model training, differences in the linguistic complexity of mathematical problems, or variations in the quality of the translated benchmark sets.
DECODING INTELLIGENCE...