# Technical Document Extraction: Scatter Plot Analysis
## Image Description
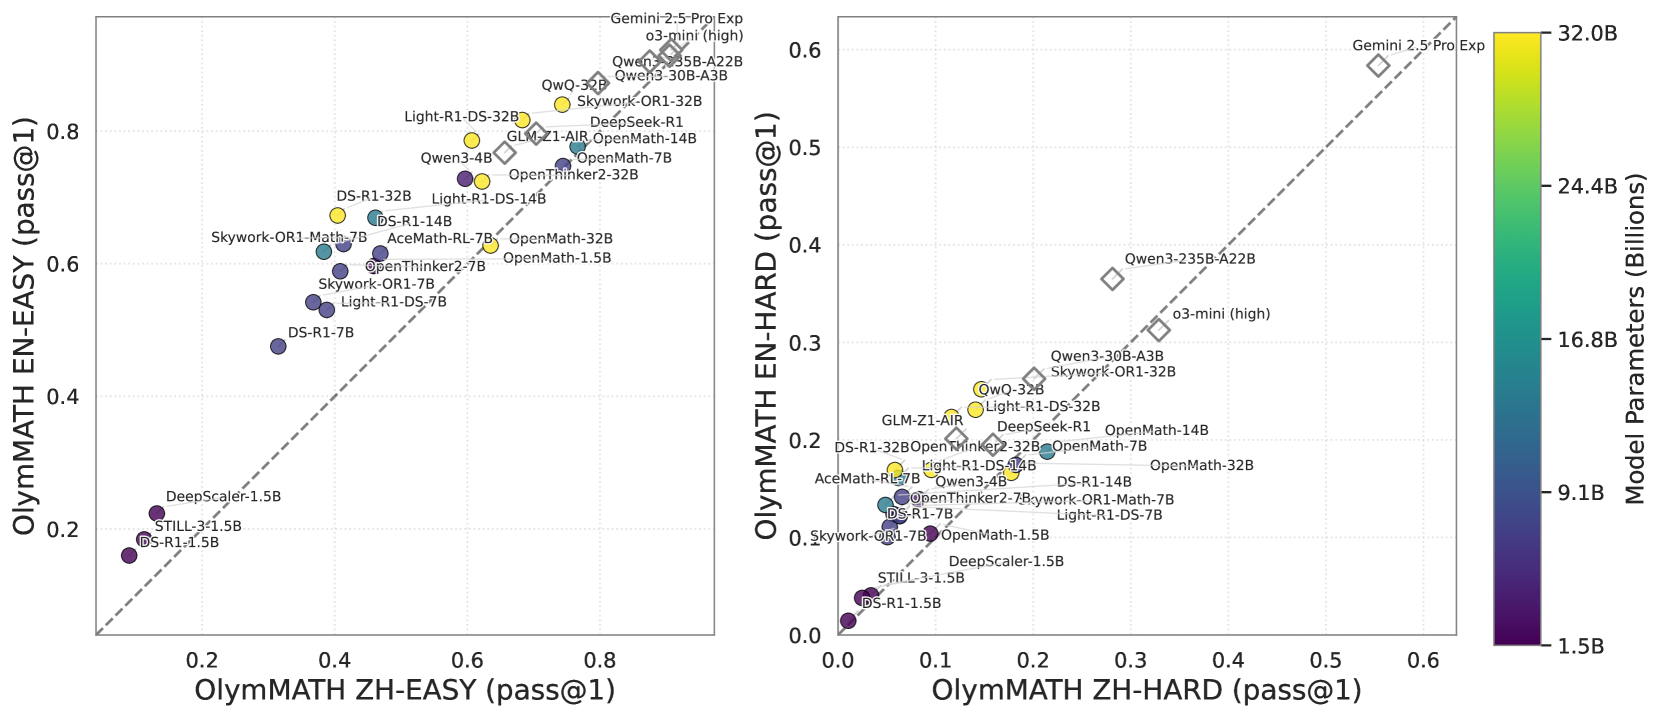
The image is a **scatter plot** with **two subplots** (left and right) comparing performance metrics of various AI models. The plots use **color-coded data points** to represent model parameters (in billions) and include **labels for specific models**. A **dashed identity line** (y = x) is present in both subplots for reference.
---
## Key Components
### 1. **Axes Labels**
- **Left Subplot (EASY):**
- **X-axis:** `OLYMATH ZH-EASY (pass@1)`
- **Y-axis:** `OLYMATH EN-EASY (pass@1)`
- **Right Subplot (HARD):**
- **X-axis:** `OLYMATH ZH-HARD (pass@1)`
- **Y-axis:** `OLYMATH EN-HARD (pass@1)`
### 2. **Legend**
- **Color Bar:**
- **Title:** `Model Parameters (Billions)`
- **Range:** `1.5B` (purple) to `32.0B` (yellow)
- **Position:** Right side of the image, vertical orientation.
### 3. **Data Points & Labels**
- **Left Subplot (EASY):**
- Data points are clustered near the identity line, with larger models (yellow) achieving higher pass@1 scores.
- **Labels (from top to bottom):**
- `Gemini 2.5 Pro Exp`
- `o3-mini (high)`
- `Qwen-335B-A22B`
- `Qwen3-30B-A3B`
- `Skywork-OR1-32B`
- `Qwen-32B`
- `Qwen3-35B-A22B`
- `Light-R1-DS-32B`
- `GLM-Z1-AIR`
- `DeepSeek-R1`
- `OpenMath-7B`
- `OpenMath-14B`
- `OpenMath-32B`
- `OpenMath-1.5B`
- `Skywork-OR1-7B`
- `OpenThinker2-7B`
- `DS-R1-7B`
- `Light-R1-DS-7B`
- `Skywork-OR1-32B`
- `DS-R1-14B`
- `AceMath-RL-7B`
- `OpenMath-32B`
- `DS-R1-32B`
- `Skywork-OR1-7B`
- `DS-R1-1.5B`
- `STILL-3-1.5B`
- `DeepScaler-1.5B`
- **Right Subplot (HARD):**
- Data points are more dispersed, with some models (e.g., `Gemini 2.5 Pro Exp`) achieving higher pass@1 scores than their ZH-HARD counterparts.
- **Labels (from top to bottom):**
- `Gemini 2.5 Pro Exp`
- `o3-mini (high)`
- `Qwen3-235B-A22B`
- `Qwen3-30B-A3B`
- `Skywork-OR1-32B`
- `Qwen-32B`
- `Qwen3-35B-A22B`
- `Light-R1-DS-32B`
- `GLM-Z1-AIR`
- `DeepSeek-R1`
- `OpenMath-7B`
- `OpenMath-14B`
- `OpenMath-32B`
- `OpenMath-1.5B`
- `Skywork-OR1-7B`
- `OpenThinker2-7B`
- `DS-R1-7B`
- `Light-R1-DS-7B`
- `Skywork-OR1-32B`
- `DS-R1-14B`
- `AceMath-RL-7B`
- `OpenMath-32B`
- `DS-R1-32B`
- `Skywork-OR1-7B`
- `DS-R1-1.5B`
- `STILL-3-1.5B`
- `DeepScaler-1.5B`
### 4. **Dashed Identity Line**
- A **dashed line** (y = x) is present in both subplots, serving as a reference for comparing ZH and EN performance.
---
## Spatial Grounding
- **Legend Position:** Right side of the image, vertical color bar.
- **Color Matching:**
- `Gemini 2.5 Pro Exp` (yellow) corresponds to `32.0B` in the legend.
- `o3-mini (high)` (yellow) corresponds to `32.0B`.
- `Qwen3-30B-A3B` (green) corresponds to `24.4B`.
- `DS-R1-1.5B` (purple) corresponds to `1.5B`.
---
## Trend Verification
- **Left Subplot (EASY):**
- Data points generally follow the identity line, with larger models (yellow) achieving higher pass@1 scores.
- Example: `Gemini 2.5 Pro Exp` (32.0B) has a pass@1 of ~0.85 on both axes.
- **Right Subplot (HARD):**
- Data points are more spread out, with some models (e.g., `Gemini 2.5 Pro Exp`) achieving higher pass@1 scores on the EN-HARD axis than on the ZH-HARD axis.
- Example: `Gemini 2.5 Pro Exp` (32.0B) has a pass@1 of ~0.6 on the EN-HARD axis and ~0.55 on the ZH-HARD axis.
---
## Notes
- **Language:** All text is in **English**.
- **Data Table:** No explicit data table is present; data is represented via scatter points and labels.
- **Missing Information:** No additional textual or numerical data is embedded in the image.
---
## Conclusion
The image compares the performance of AI models on **ZH-EASY**, **EN-EASY**, **ZH-HARD**, and **EN-HARD** tasks, with model parameters (in billions) represented via color. Larger models (e.g., `Gemini 2.5 Pro Exp`) generally perform better, but performance varies between ZH and EN tasks.