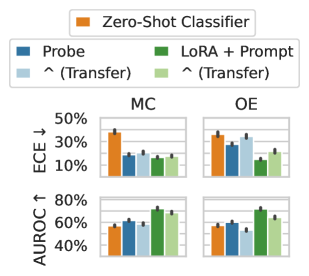
## Bar Chart: Performance Comparison of Different Methods
### Overview
The image presents a bar chart comparing the performance of different methods (Zero-Shot Classifier, Probe, LoRA + Prompt) on two metrics: ECE (Error Calibration Error) and AUROC (Area Under the Receiver Operating Characteristic curve). The chart is divided into two sections, MC and OE, likely representing different datasets or tasks. The chart compares the performance of these methods, including transfer learning variants, across two different evaluation metrics.
### Components/Axes
* **Y-Axis (Left):**
* ECE ↓ (Error Calibration Error): Ranges from 10% to 50%. Lower values are better.
* AUROC ↑ (Area Under the Receiver Operating Characteristic curve): Ranges from 40% to 80%. Higher values are better.
* **X-Axis:** Categorical, representing different methods:
* Zero-Shot Classifier (Orange)
* Probe (Dark Blue)
* ^(Transfer) (Light Blue) - Transfer learning variant of Probe
* LoRA + Prompt (Dark Green)
* ^(Transfer) (Light Green) - Transfer learning variant of LoRA + Prompt
* **Chart Sections:**
* MC (Likely representing a dataset or task)
* OE (Likely representing a different dataset or task)
* **Legend (Top):**
* Zero-Shot Classifier (Orange)
* Probe (Dark Blue)
* ^(Transfer) (Light Blue)
* LoRA + Prompt (Dark Green)
* ^(Transfer) (Light Green)
### Detailed Analysis
**ECE (Error Calibration Error) - Lower is better**
* **MC:**
* Zero-Shot Classifier (Orange): Approximately 35% ± 2%
* Probe (Dark Blue): Approximately 24% ± 1%
* Probe ^(Transfer) (Light Blue): Approximately 26% ± 1%
* LoRA + Prompt (Dark Green): Approximately 23% ± 1%
* LoRA + Prompt ^(Transfer) (Light Green): Approximately 24% ± 1%
* **OE:**
* Zero-Shot Classifier (Orange): Approximately 33% ± 2%
* Probe (Dark Blue): Approximately 29% ± 2%
* Probe ^(Transfer) (Light Blue): Approximately 30% ± 2%
* LoRA + Prompt (Dark Green): Approximately 18% ± 1%
* LoRA + Prompt ^(Transfer) (Light Green): Approximately 26% ± 2%
**AUROC (Area Under the Receiver Operating Characteristic curve) - Higher is better**
* **MC:**
* Zero-Shot Classifier (Orange): Approximately 58% ± 2%
* Probe (Dark Blue): Approximately 62% ± 2%
* Probe ^(Transfer) (Light Blue): Approximately 68% ± 1%
* LoRA + Prompt (Dark Green): Approximately 72% ± 1%
* LoRA + Prompt ^(Transfer) (Light Green): Approximately 70% ± 1%
* **OE:**
* Zero-Shot Classifier (Orange): Approximately 59% ± 2%
* Probe (Dark Blue): Approximately 55% ± 2%
* Probe ^(Transfer) (Light Blue): Approximately 52% ± 2%
* LoRA + Prompt (Dark Green): Approximately 72% ± 1%
* LoRA + Prompt ^(Transfer) (Light Green): Approximately 65% ± 2%
### Key Observations
* LoRA + Prompt generally performs better than Zero-Shot Classifier and Probe in terms of AUROC.
* Transfer learning (^(Transfer)) seems to improve performance for both Probe and LoRA + Prompt in most cases, especially for AUROC on the MC dataset.
* LoRA + Prompt shows a significant improvement in ECE on the OE dataset compared to other methods.
* The performance differences between methods are more pronounced for AUROC than for ECE.
### Interpretation
The data suggests that LoRA + Prompt is a more effective method for these tasks, particularly when considering the AUROC metric. The use of transfer learning further enhances the performance of both Probe and LoRA + Prompt. The choice of dataset (MC vs. OE) also influences the relative performance of the different methods, indicating that some methods are more sensitive to the specific characteristics of the data. The lower ECE values for LoRA + Prompt on the OE dataset suggest that this method is better calibrated in its predictions for this particular dataset. Overall, the results highlight the benefits of using LoRA + Prompt and transfer learning for improving model performance and calibration.