\n
## Bar Chart: Model Calibration and Discrimination Performance (ECE & AUROC)
### Overview
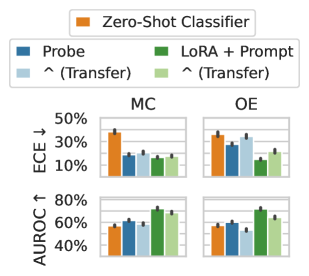
The image displays a 2x2 grid of grouped bar charts comparing the performance of five different classification methods across two evaluation metrics (ECE and AUROC) and two distinct conditions or datasets (labeled "MC" and "OE"). The charts include error bars, indicating variability or confidence intervals for each measurement.
### Components/Axes
* **Legend (Top Center):** A horizontal legend identifies five methods by color:
* **Orange Square:** Zero-Shot Classifier
* **Blue Square:** Probe
* **Light Blue Square:** ^ (Transfer) [Associated with Probe]
* **Green Square:** LoRA + Prompt
* **Light Green Square:** ^ (Transfer) [Associated with LoRA + Prompt]
* **Chart Grid:** The charts are arranged in two rows and two columns.
* **Columns:** Labeled "MC" (left column) and "OE" (right column) at the top.
* **Rows:** The top row measures **ECE ↓** (Expected Calibration Error, where lower is better). The bottom row measures **AUROC ↑** (Area Under the Receiver Operating Characteristic Curve, where higher is better).
* **Y-Axes:**
* **Top Row (ECE):** Labeled "ECE ↓". Scale ranges from 10% to 50%, with major ticks at 10%, 30%, and 50%.
* **Bottom Row (AUROC):** Labeled "AUROC ↑". Scale ranges from 40% to 80%, with major ticks at 40%, 60%, and 80%.
* **X-Axis (Implicit):** Within each subplot, five bars are grouped, corresponding to the five methods in the legend order (Zero-Shot, Probe, Probe-Transfer, LoRA+Prompt, LoRA+Prompt-Transfer).
### Detailed Analysis
**Top Row: ECE (Expected Calibration Error) - Lower is Better**
* **MC Condition (Top-Left Chart):**
* **Zero-Shot Classifier (Orange):** Highest ECE, approximately 40% (±~3%).
* **Probe (Blue):** ECE ~20% (±~2%).
* **Probe Transfer (Light Blue):** ECE ~25% (±~2%), slightly worse than Probe.
* **LoRA + Prompt (Green):** ECE ~15% (±~2%), the lowest in this group.
* **LoRA + Prompt Transfer (Light Green):** ECE ~20% (±~2%), slightly worse than its non-transfer counterpart.
* **OE Condition (Top-Right Chart):**
* **Zero-Shot Classifier (Orange):** ECE ~35% (±~3%).
* **Probe (Blue):** ECE ~25% (±~2%).
* **Probe Transfer (Light Blue):** ECE ~30% (±~2%).
* **LoRA + Prompt (Green):** ECE ~15% (±~2%), again the lowest.
* **LoRA + Prompt Transfer (Light Green):** ECE ~20% (±~2%).
**Bottom Row: AUROC (Area Under ROC) - Higher is Better**
* **MC Condition (Bottom-Left Chart):**
* **Zero-Shot Classifier (Orange):** AUROC ~50% (±~3%).
* **Probe (Blue):** AUROC ~60% (±~3%).
* **Probe Transfer (Light Blue):** AUROC ~60% (±~3%), similar to Probe.
* **LoRA + Prompt (Green):** AUROC ~70% (±~3%), the highest in this group.
* **LoRA + Prompt Transfer (Light Green):** AUROC ~68% (±~3%), slightly lower than its non-transfer counterpart.
* **OE Condition (Bottom-Right Chart):**
* **Zero-Shot Classifier (Orange):** AUROC ~55% (±~3%).
* **Probe (Blue):** AUROC ~60% (±~3%).
* **Probe Transfer (Light Blue):** AUROC ~60% (±~3%).
* **LoRA + Prompt (Green):** AUROC ~70% (±~3%), the highest.
* **LoRA + Prompt Transfer (Light Green):** AUROC ~65% (±~3%).
### Key Observations
1. **Consistent Superiority of LoRA + Prompt:** The "LoRA + Prompt" method (green bar) consistently achieves the best performance across all four subplots: the lowest ECE (best calibration) and the highest AUROC (best discrimination) in both MC and OE conditions.
2. **Zero-Shot Classifier Underperformance:** The "Zero-Shot Classifier" (orange bar) consistently performs the worst, showing the highest ECE and the lowest AUROC in all scenarios.
3. **Impact of Transfer Learning:** The effect of transfer learning (light-colored bars) is mixed and generally negative or neutral.
* For **Probe**, transfer learning increases ECE (worsens calibration) in both MC and OE, while having a negligible effect on AUROC.
* For **LoRA + Prompt**, transfer learning slightly increases ECE and slightly decreases AUROC compared to the non-transfer version.
4. **Metric Trends:** The visual trends are clear: lines/bars for ECE slope downward from Zero-Shot to LoRA+Prompt, while lines/bars for AUROC slope upward across the same sequence.
### Interpretation
This chart provides a clear comparative analysis of model adaptation techniques for classification tasks. The data strongly suggests that **fine-tuning with LoRA (Low-Rank Adaptation) combined with prompt engineering ("LoRA + Prompt") is the most effective strategy** among those tested. It yields models that are both better calibrated (lower ECE, meaning their predicted probabilities more accurately reflect true correctness likelihood) and better at distinguishing between classes (higher AUROC).
The poor performance of the Zero-Shot Classifier establishes a baseline, highlighting the significant gains achievable through parameter-efficient fine-tuning (LoRA) and prompt design. The "Probe" method, which likely involves training a simple classifier on top of frozen model features, offers a middle ground.
The **negative or neutral impact of transfer learning** is a notable finding. It implies that for these specific methods and tasks, adapting a model that was previously fine-tuned for a *different* task (the "transfer" scenario) does not improve—and may even harm—performance compared to fine-tuning directly on the target task. This could be due to negative transfer or misalignment between the source and target tasks.
In summary, the visualization argues for the direct application of LoRA with prompts over zero-shot or probe-based approaches, and cautions against assuming that transfer learning will automatically improve results in this context. The consistent ranking of methods across two different conditions (MC and OE) and two complementary metrics adds robustness to this conclusion.