## Line Graphs: Success Rate vs. δ = n/d and Final Correlation vs. δ = n/d
### Overview
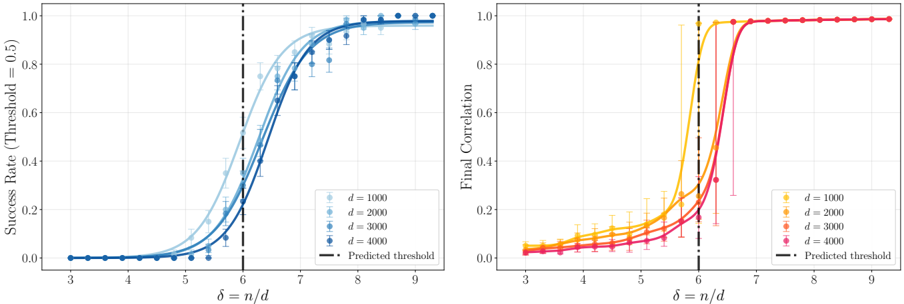
The image contains two side-by-side line graphs. The left graph plots "Success Rate (Threshold = 0.5)" against δ = n/d (x-axis), while the right graph plots "Final Correlation" against the same x-axis. Both graphs include multiple data series differentiated by line color/shade and error bars. A vertical dashed line at δ = 6 is labeled as the "Predicted threshold" in both graphs.
---
### Components/Axes
#### Left Graph (Success Rate)
- **X-axis**: δ = n/d (ranges from 3 to 9, labeled in increments of 1).
- **Y-axis**: Success Rate (Threshold = 0.5) (ranges from 0.0 to 1.0, labeled in increments of 0.2).
- **Legend**: Located at the bottom-left corner. Entries:
- `d = 1000` (light blue line with shaded area).
- `d = 2000` (medium blue line with shaded area).
- `d = 3000` (dark blue line with shaded area).
- **Dashed Line**: Vertical line at δ = 6 (black, labeled "Predicted threshold").
#### Right Graph (Final Correlation)
- **X-axis**: δ = n/d (same scale as left graph).
- **Y-axis**: Final Correlation (ranges from 0.0 to 1.0, labeled in increments of 0.2).
- **Legend**: Located at the bottom-right corner. Entries:
- `d = 1000` (light yellow line with shaded area).
- `d = 2000` (orange line with shaded area).
- `d = 3000` (dark orange line with shaded area).
- `d = 4000` (red line with shaded area).
- **Dashed Line**: Vertical line at δ = 6 (black, labeled "Predicted threshold").
---
### Detailed Analysis
#### Left Graph (Success Rate)
- **Trend**: All lines show a sigmoidal increase. Success rate remains near 0 for δ < 5, then rises sharply after δ = 6.
- **Data Points**:
- **d = 1000**: Crosses threshold (0.5) at δ ≈ 6.5. Final value ≈ 0.95 at δ = 9.
- **d = 2000**: Crosses threshold at δ ≈ 6.3. Final value ≈ 0.98 at δ = 9.
- **d = 3000**: Crosses threshold at δ ≈ 6.2. Final value ≈ 0.99 at δ = 9.
- **Error Bars**: Smaller for higher d values (e.g., d = 3000 has tighter error margins than d = 1000).
#### Right Graph (Final Correlation)
- **Trend**: All lines plateau near 1.0 after δ = 6. Correlation remains low (≈0.1–0.2) for δ < 5.
- **Data Points**:
- **d = 1000**: Crosses threshold at δ ≈ 6.3. Final value ≈ 0.98 at δ = 9.
- **d = 2000**: Crosses threshold at δ ≈ 6.1. Final value ≈ 0.99 at δ = 9.
- **d = 3000**: Crosses threshold at δ ≈ 6.0. Final value ≈ 1.0 at δ = 9.
- **d = 4000**: Crosses threshold at δ ≈ 5.9. Final value ≈ 1.0 at δ = 9.
- **Error Bars**: Larger for smaller d values (e.g., d = 1000 has wider error margins than d = 4000).
---
### Key Observations
1. **Threshold Consistency**: Both graphs show the predicted threshold at δ = 6, but actual crossing points vary slightly by d value.
2. **d Value Impact**: Larger d values (e.g., 4000) achieve higher success rates and correlations at lower δ values compared to smaller d values (e.g., 1000).
3. **Convergence**: Lines for higher d values cluster closer to the predicted threshold line, suggesting diminishing returns beyond δ = 6.
---
### Interpretation
- **Success Rate**: The threshold δ = 6 marks the point where success rate exceeds 0.5. Larger d values (more data) achieve this threshold earlier, indicating improved performance with increased data size.
- **Final Correlation**: Similarly, higher d values reach near-perfect correlation (≈1.0) sooner, suggesting that δ = 6 is a critical inflection point for model reliability.
- **Error Margins**: Smaller d values exhibit greater variability (wider error bars), reinforcing the need for larger datasets to stabilize results.
- **Practical Implication**: The predicted threshold δ = 6 may serve as a guideline for balancing computational efficiency (lower δ) and performance (higher success/correlation). However, real-world application should account for d-dependent variability.