\n
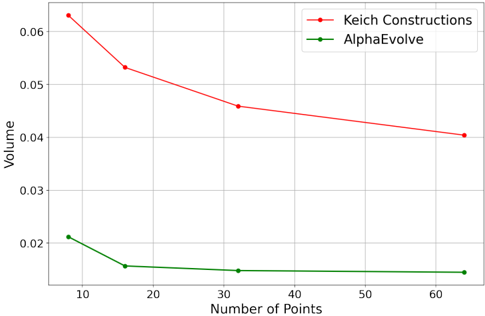
## Line Chart: Volume vs. Number of Points
### Overview
The image presents a line chart comparing the "Volume" of two methods, "Keich Constructions" and "AlphaEvolve", as a function of the "Number of Points". The chart displays a decreasing trend for both methods as the number of points increases, but the rate of decrease differs significantly.
### Components/Axes
* **X-axis:** "Number of Points", ranging from approximately 10 to 60, with markers at 10, 20, 30, 40, 50, and 60.
* **Y-axis:** "Volume", ranging from approximately 0.02 to 0.07, with markers at 0.02, 0.03, 0.04, 0.05, and 0.06.
* **Data Series 1:** "Keich Constructions" represented by a red dashed line with circular markers.
* **Data Series 2:** "AlphaEvolve" represented by a green dashed line with circular markers.
* **Legend:** Located in the top-right corner, associating colors with method names.
### Detailed Analysis
**Keich Constructions (Red Line):**
The red line exhibits a downward slope, indicating a decrease in volume as the number of points increases.
* At 10 points, the volume is approximately 0.064.
* At 20 points, the volume is approximately 0.054.
* At 30 points, the volume is approximately 0.048.
* At 40 points, the volume is approximately 0.045.
* At 50 points, the volume is approximately 0.043.
* At 60 points, the volume is approximately 0.041.
**AlphaEvolve (Green Line):**
The green line also shows a decreasing trend, but the decrease is less pronounced than that of "Keich Constructions".
* At 10 points, the volume is approximately 0.023.
* At 20 points, the volume is approximately 0.018.
* At 30 points, the volume is approximately 0.016.
* At 40 points, the volume is approximately 0.015.
* At 50 points, the volume is approximately 0.015.
* At 60 points, the volume is approximately 0.015.
### Key Observations
* "Keich Constructions" consistently exhibits a higher volume than "AlphaEvolve" across all tested numbers of points.
* The rate of volume decrease is much steeper for "Keich Constructions" than for "AlphaEvolve". "AlphaEvolve" appears to plateau around 40 points.
* The volume for "AlphaEvolve" remains relatively stable after 30 points.
### Interpretation
The chart suggests that increasing the number of points generally leads to a reduction in volume for both methods. However, "Keich Constructions" is more sensitive to changes in the number of points, experiencing a more significant volume reduction. This could indicate that "Keich Constructions" requires more computational resources or becomes less efficient as the number of points increases. "AlphaEvolve", on the other hand, appears to be more robust and maintains a relatively stable volume even with a larger number of points. The difference in behavior could be due to the underlying algorithms or implementation details of each method. The plateauing of "AlphaEvolve" suggests a potential limit to the benefits of adding more points beyond a certain threshold. Further investigation would be needed to understand the specific reasons for these differences and to determine the optimal number of points for each method based on desired volume and performance characteristics.